
The Real Bottleneck
Most congested roads aren't the problem; they're backed up behind one. How software separates traffic causes from symptoms, on every road, no cameras.

Open any live traffic map and you see the same thing: red and orange everywhere, roads crawling at once. It looks like the whole network is the problem. It isn't. Most of that red isn't a cause of congestion; it's a casualty of it. Here's how we taught software to tell the two apart, on every road, without a single camera.
The map tells you where, not why
A congestion map shows which roads are slow right now. Useful, but it encourages a mistake: assuming every slow road is worth fixing.
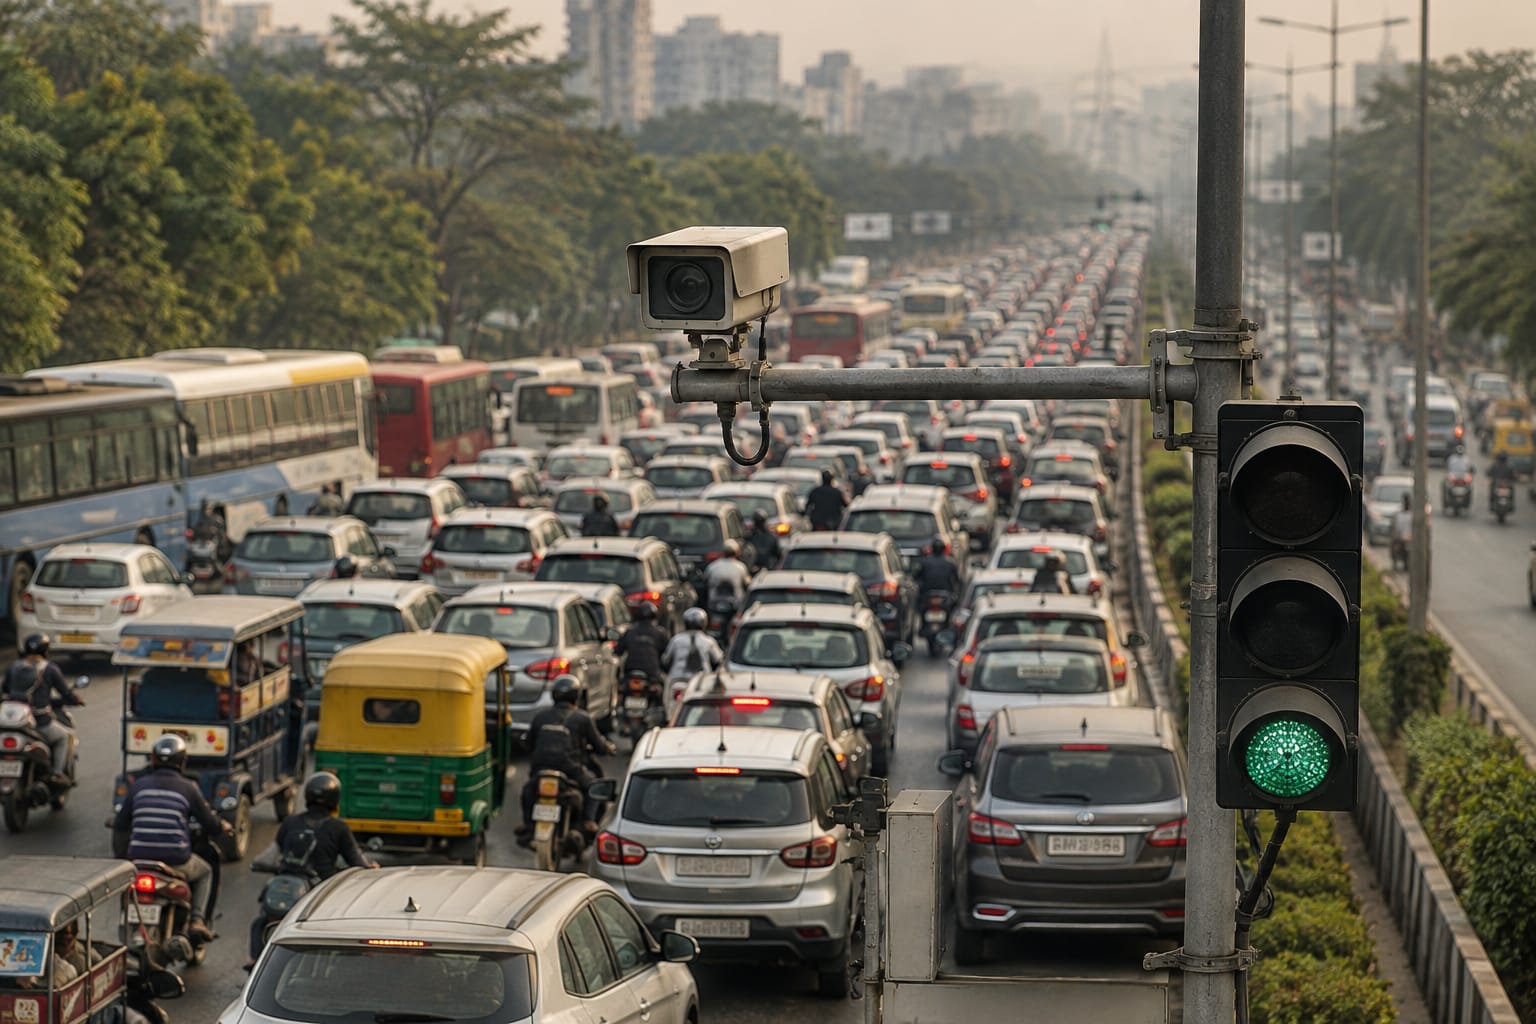
When a junction seizes up at rush hour, the queue doesn't stay at the junction. It grows backwards, road by road, into the side streets behind it. Within twenty minutes one choke point has painted half a neighbourhood red. On the map they all look equally congested; only one is the reason.
So "150 congested segments today" is really a handful of genuine bottlenecks and a long tail stuck behind them. Treat it as 150 problems and you'll re-time signals and widen lanes on roads that would clear on their own the moment the real bottleneck upstream is fixed. We built a pipeline that asks, for every congested stretch, a different question: is this road the head of a jam, or just its tail?
Five out of six congested roads are not the problem. That's why a short, ranked list of causes beats a heat-map of symptoms, and finding that one-in-six is the whole job.
One jam, one head, a long tail
Congestion travels backwards. A bottleneck, a junction or a merge where lanes pinch, throws off a queue that moves upstream, like water backing up behind a blocked drain. Where the water is blocked is the cause; everything behind it is the effect.
That gives a testable rule: a road is a victim only if the jam it's stuck in started downstream of it. If it's crawling but the road ahead is clear enough to drain into, the queue starts here, and this road is a cause.
A real bottleneck has to have somewhere to drain. If the road just ahead is moving freely and this one isn't, the problem is here, not three blocks up.
How the software tells them apart
None of this needs new hardware. The input is one traffic reading per road every 10 minutes, covering the whole network, so every road is effectively a sensor. From there, a few plain steps run daily:
Measure each road against its own normal. Every road is scored against its own clear-road speed, as a share of it, so the same measure works on a narrow market lane and a six-lane expressway alike.
Look for real slowdowns, not blips. A jam only counts when a road stays slow for a real stretch, and the system is slow to call it over, so one long jam doesn't fragment into ten short ones.
Walk downstream to find the drain. For each congested road, the software looks forward for a jam that started earlier and that this road is backing up behind. Find one and it's a victim; find nothing and it's a cause.
Score how sure we are, per city. Each candidate cause gets a confidence score, and the system first learns what "normal" looks like in that city, so nothing is hand-tuned.
Keep only what comes back. A one-off is an incident. What we report is a spot that jams again and again, labelled in plain terms: every day, weekdays, weekends, building, or fading.
From a whole network down to a short list
Put together, the pipeline is a funnel, from the whole network down to a page you could hand an engineer on Monday. One month in Hyderabad:
From nearly ten thousand segments, about a hundred and twenty places are genuinely, repeatably responsible for the city's recurring congestion.
The same shape shows up city after city
Hyderabad isn't special. Pointing the same system at a new city is a handful of settings, no new code. Run over a month in three very different cities, the output has the same shape:
Recurring congestion is a short list. One to two hundred spots, out of thousands of congested roads, carry the recurring problem, a to-do list, not a fog.
Mostly ordinary roads, but the worst are junctions. Most recurring bottlenecks sit on ordinary stretches and the most common pattern is every day, yet the handful that top the severity list are junctions where several roads meet.
Victims outnumber causes everywhere. Roads merely stuck behind a bottleneck outnumber the bottlenecks by about 7-to-1 in Delhi and more than 10-to-1 in Hyderabad and Bengaluru.
What one bottleneck really looks like
Zoom into a single site and the numbers stay honest. Each city's worst bottleneck tells the same story:
- Hyderabad, a T-junction on Basheerbagh Road. Jams every single day, ~9:50 am to past 9 pm. Speed collapses from 37 to 8 km/h, costs an extra 14 minutes, and backs up 2.4 km across 38 roads.
- Delhi, the Africa Avenue junction. Every day, dawn to past midnight. Speed roughly halves, 21 to 11 km/h, dragging in 40 roads over 2.2 km.
- Bengaluru, a multi-road junction. Every day, 07:50 to past 11 pm. Speed drops from 17 to under 8 km/h, a 1.7 km queue across 27 roads.
Those 38, 40, and 27 roads are the point: on a plain map each glows red like a separate problem. The system traces them to their one shared cause and shows the whole chain as a single spot. Fix the head, and the tail clears.
Why this changes what a city does
A heat-map says the city is congested, which everyone knew. A ranked list of causes says where to act, in what order, for the most relief per rupee, because each cause you clear drains a whole tail of victims behind it. And it scales like software, not construction: the same pipeline produced all three cities' lists with no city-specific code, no cameras, no civil work, just the data cities already generate.
How we measured this, and one honest caveat
It all runs on one input, a traffic reading per road every 10 minutes, plus the road network's shape. No camera feeds, no signal data, no pre-made list of bottlenecks, the causes come from the traffic alone.
One honest caveat: there's no official list of a city's "true" bottlenecks to score against, so we validate by internal consistency, by ranking on real delay, and by that six-fold gap versus counting every slow road. The ranking is solid; a few exact speed figures are close estimates, not decimals. More data only sharpens the picture.
Most of the congestion you can see is a symptom. The value is in the causes underneath, a short, ranked, repeatable list, and that's a software problem, solvable on data cities already generate.
Read the technical paper
- Recurrent Road Bottleneck Detection via Causal Origin-Victim Attribution (PDF), the full method behind this post, by Om Jain and Umang Saraf, Lepton Software.
Want this for your city? Book a demo and we'll point the same pipeline at your network and hand back the list.
Frequently asked questions
Why are most congested roads not the cause of congestion?
Congestion travels backwards. A bottleneck throws off a queue that grows upstream, so a single choke point can paint half a neighbourhood red within twenty minutes. On a map every road looks equally slow, but only the head of the jam is the cause. Roughly five out of six congested roads are victims backed up behind a cause, not causes themselves.
How does TraffiCure tell a cause from a symptom without cameras?
It uses one traffic reading per road every ten minutes across the whole network, so every road acts as a sensor. For each congested road it walks downstream looking for a jam that started earlier that this road is backing up behind. If it finds one, the road is a victim; if it finds nothing to drain into, the road is a cause. No cameras, signal data, or pre-made bottleneck lists are used.
What did the method find in Hyderabad?
Over one month it monitored 9,856 road segments, of which 1,827 were congested at least once, and narrowed those to about 120 recurring bottlenecks that are genuinely responsible for the city's repeat congestion. The same pipeline runs on other cities with only configuration changes and no new code.
TraffiCure delivers real-time traffic intelligence for every road in your city, on existing data, with no civil work. See all features or book a demo to see your city's data.
See it on your own city's roads.
Book a demo to see your city's data.