
Today · Network Analytics
Check how the whole city is doing
One screen for the whole city: how fast it is moving, what kind of trouble it has, and which roads drag it down.
5 stepsAbout 1 minClick the blue dot, or press →
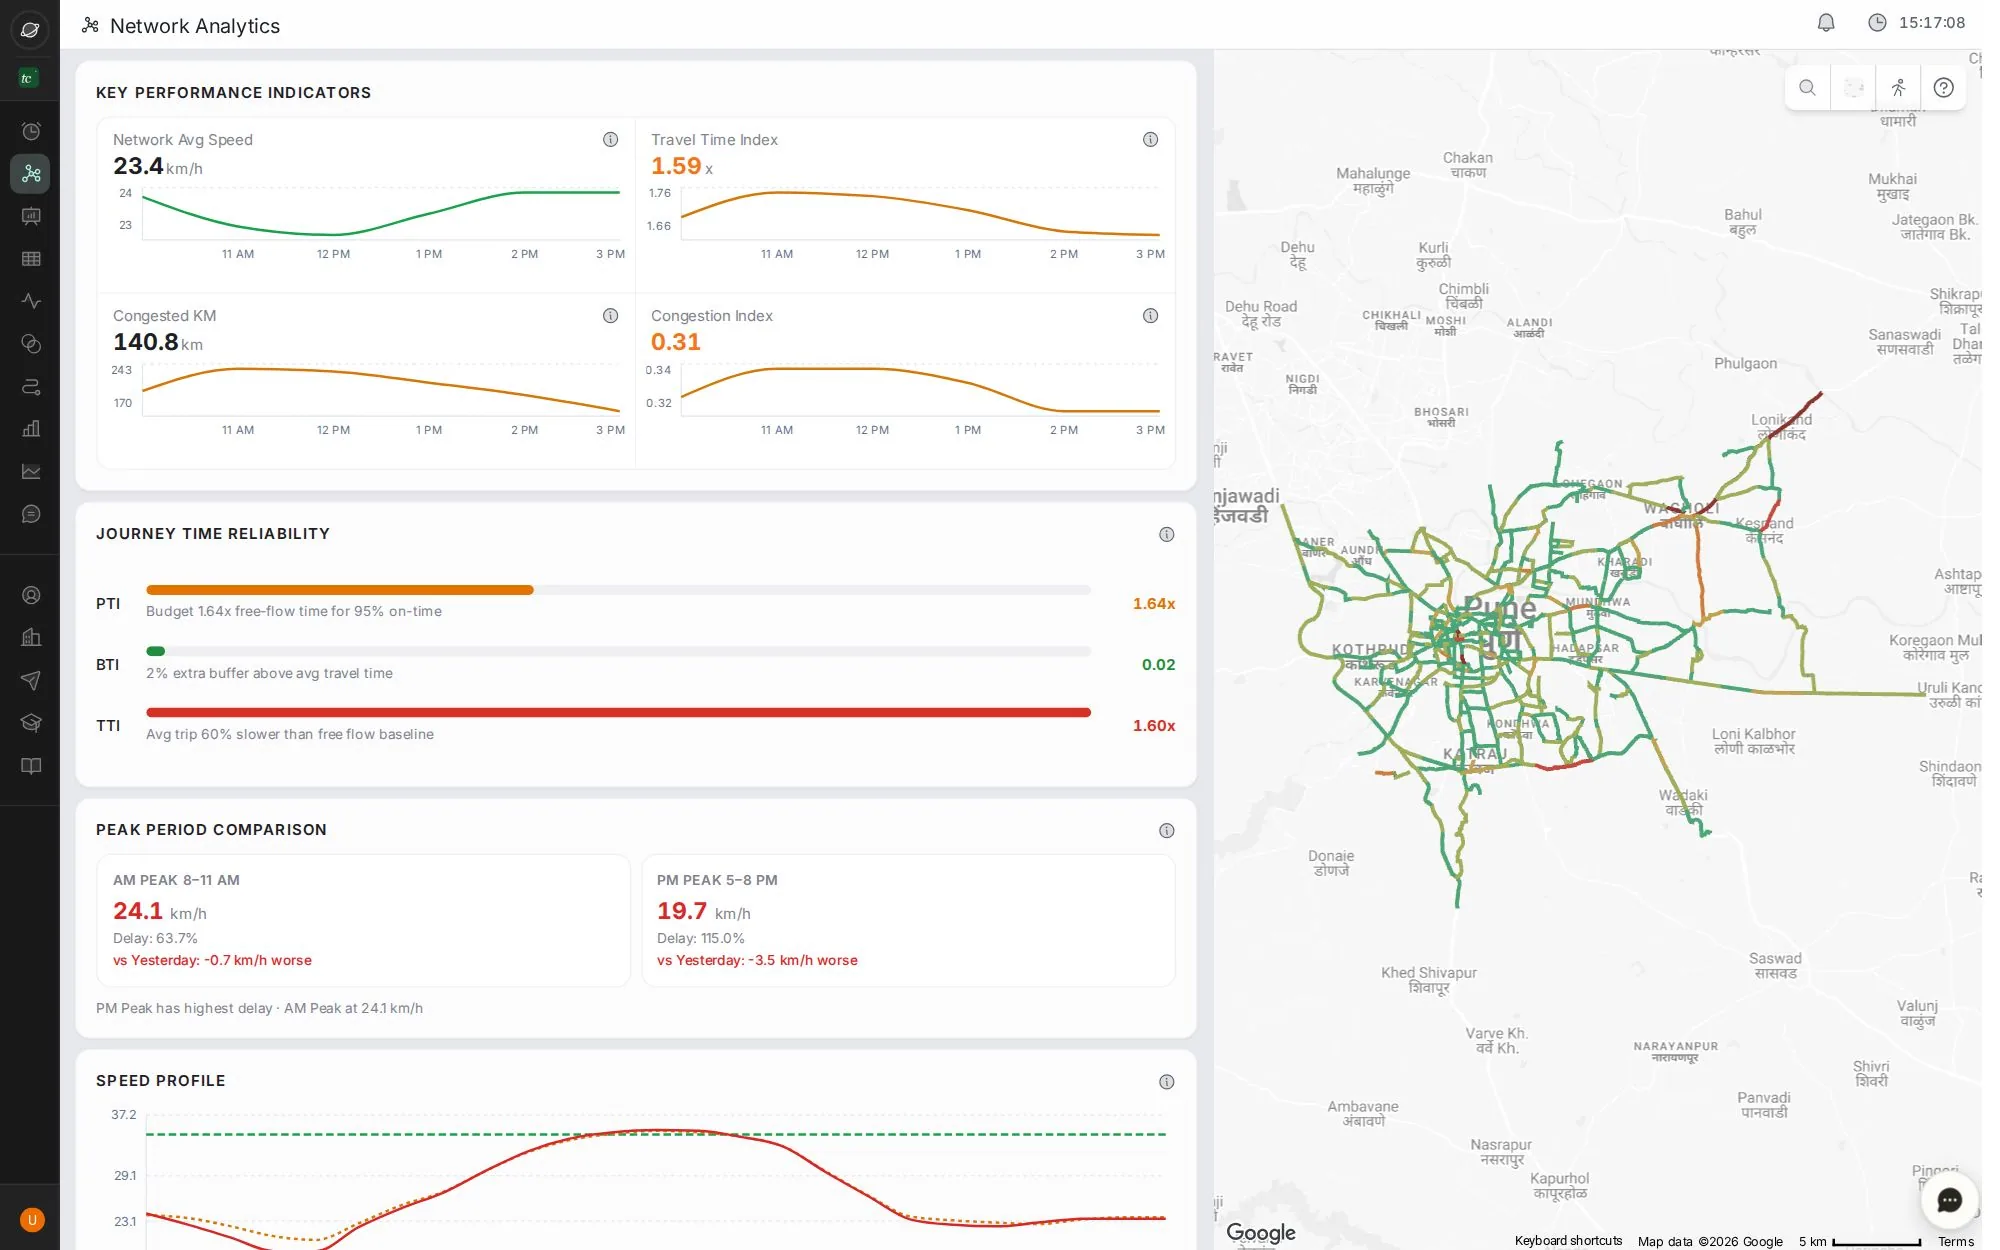
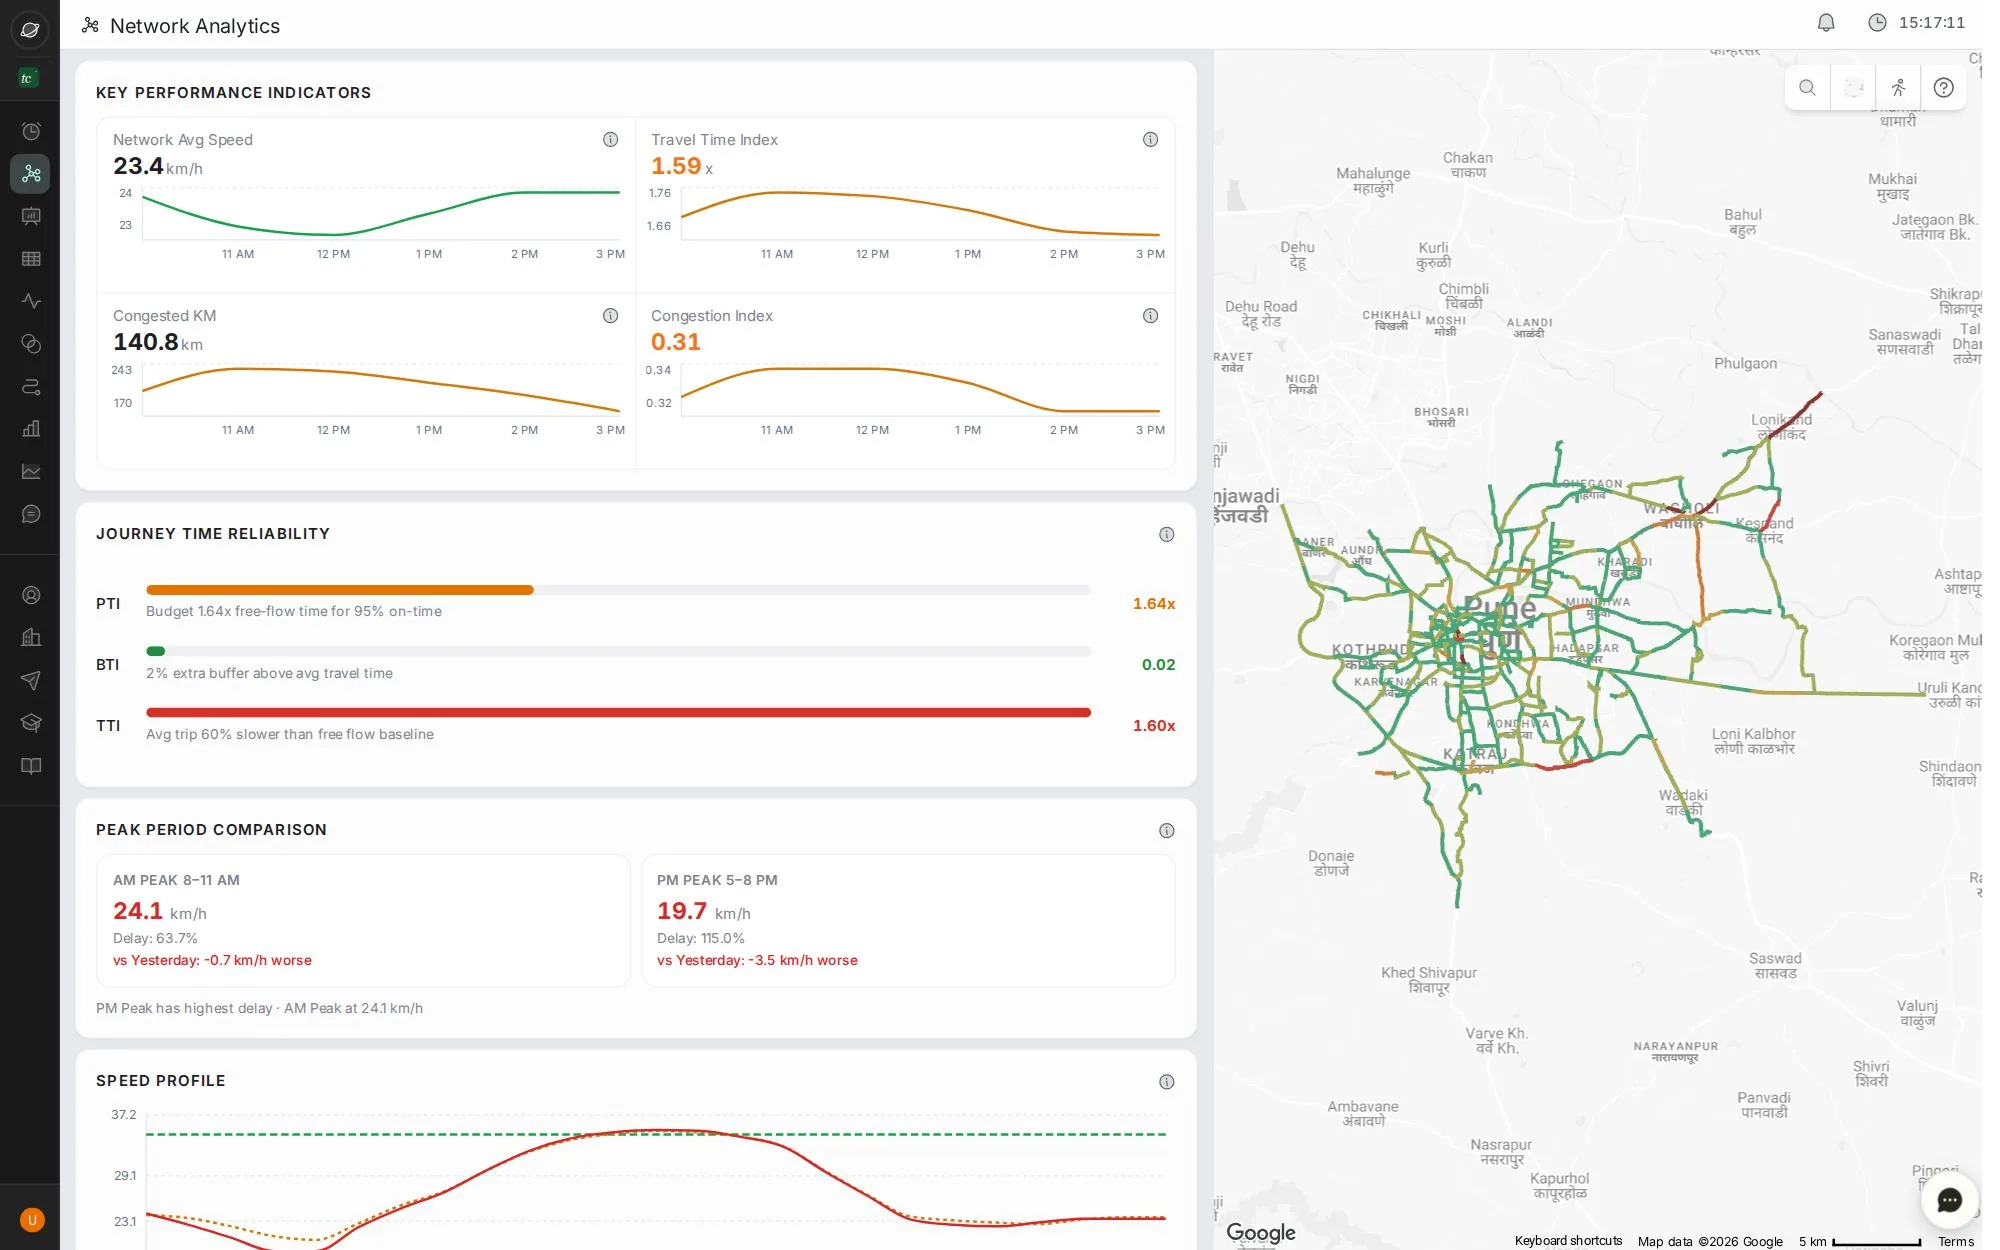
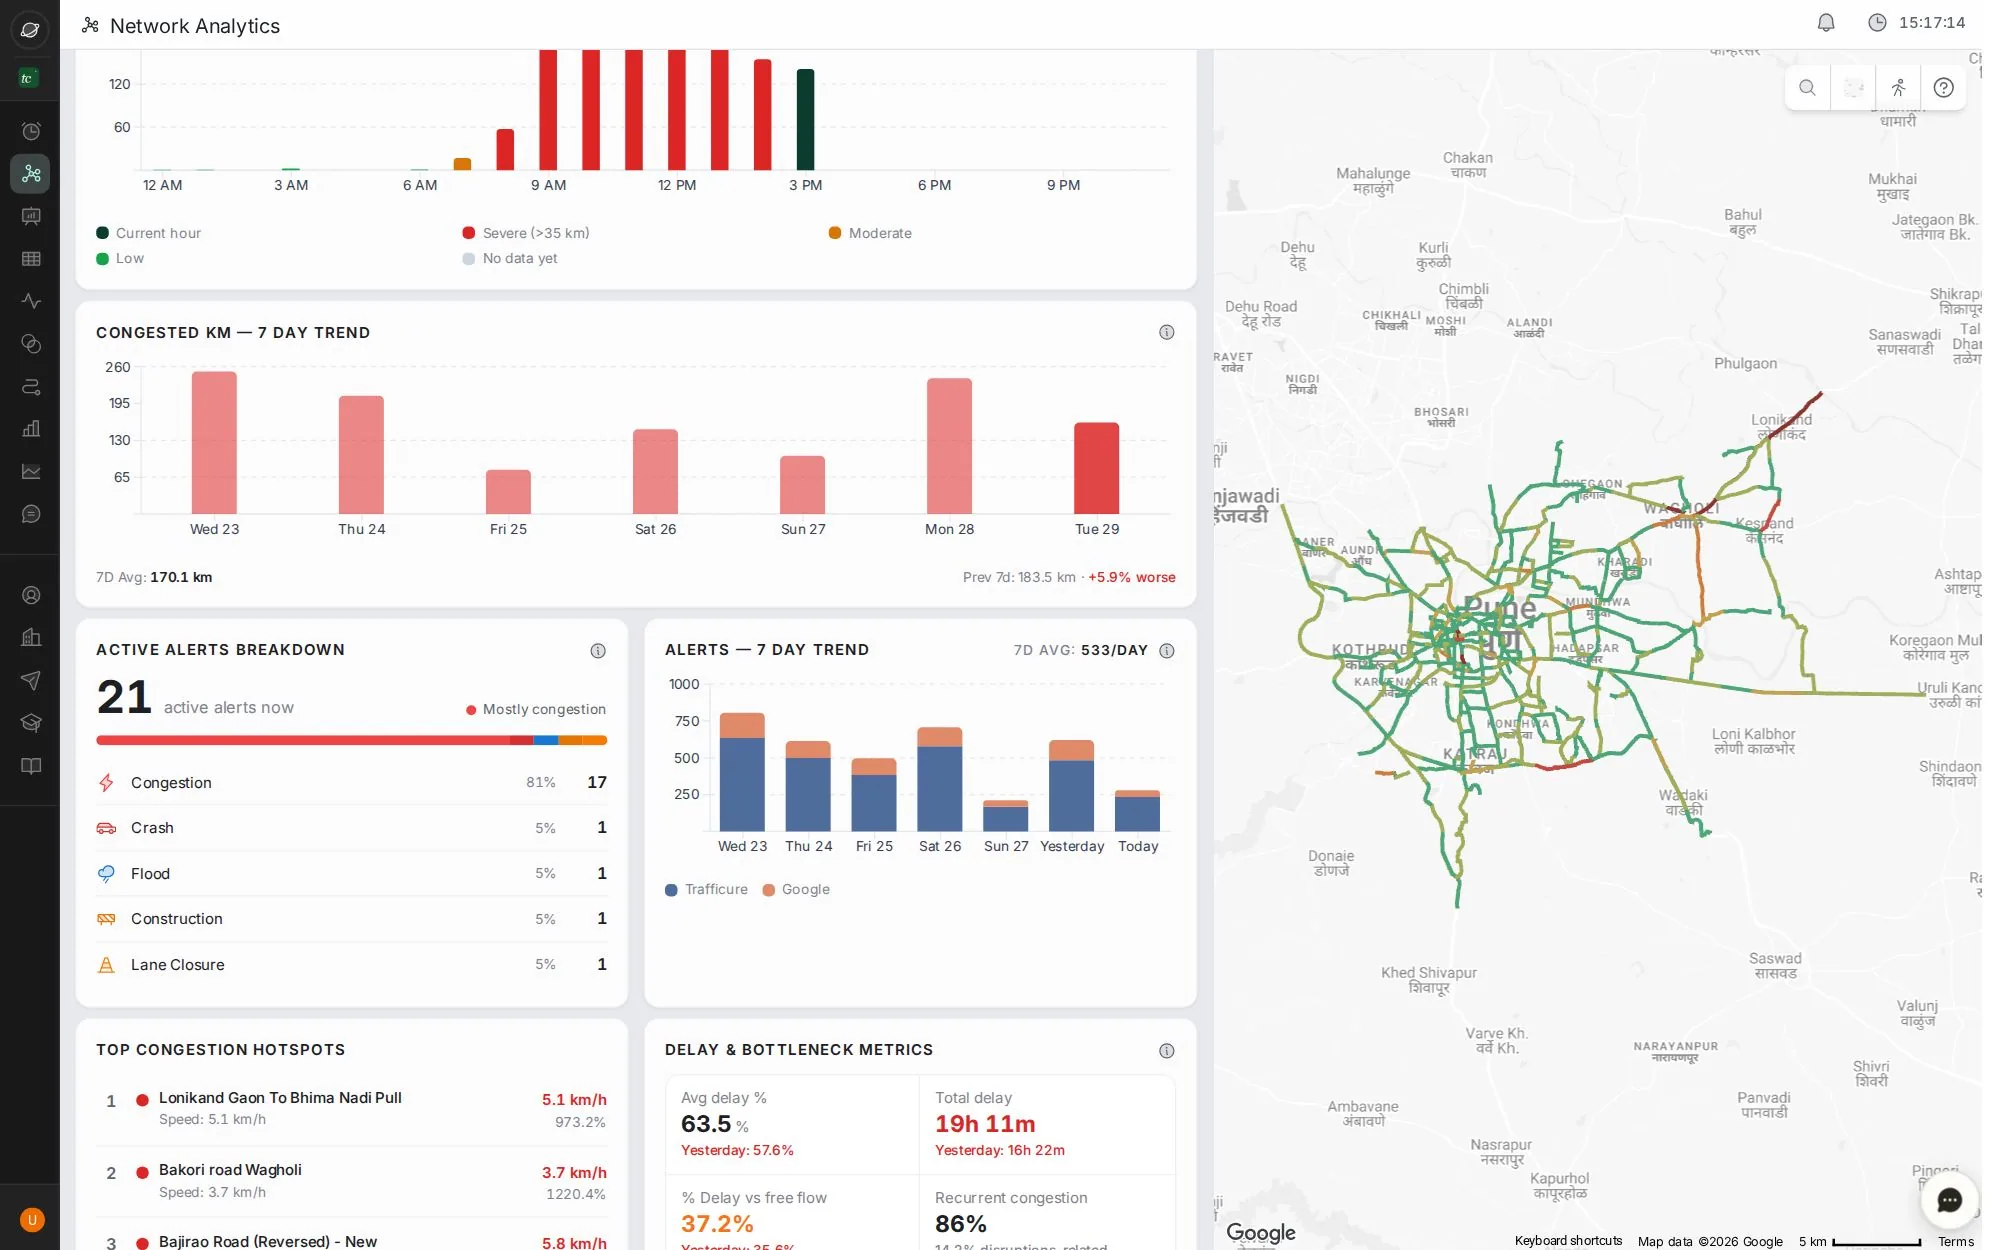
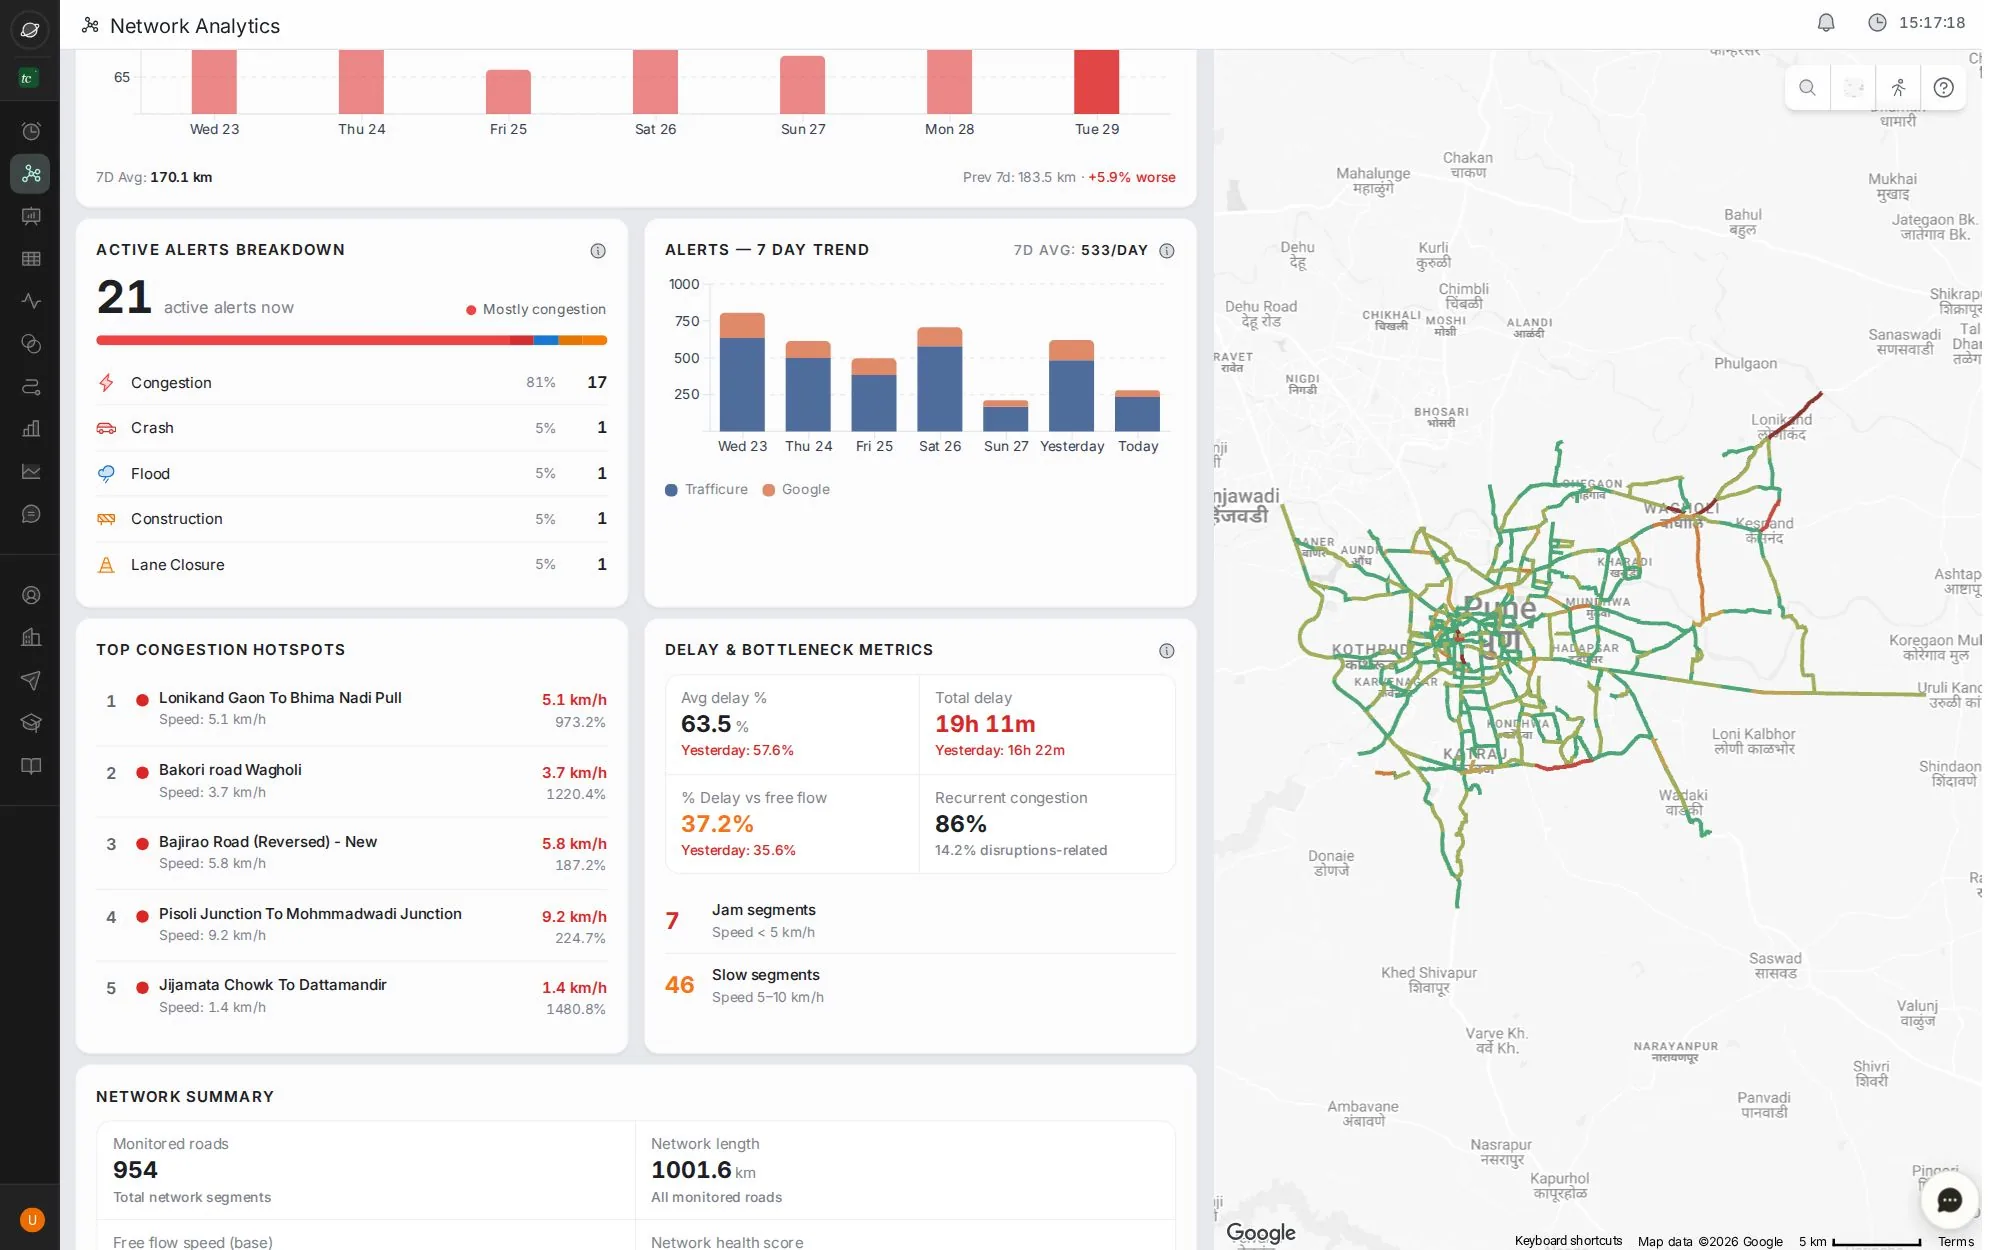
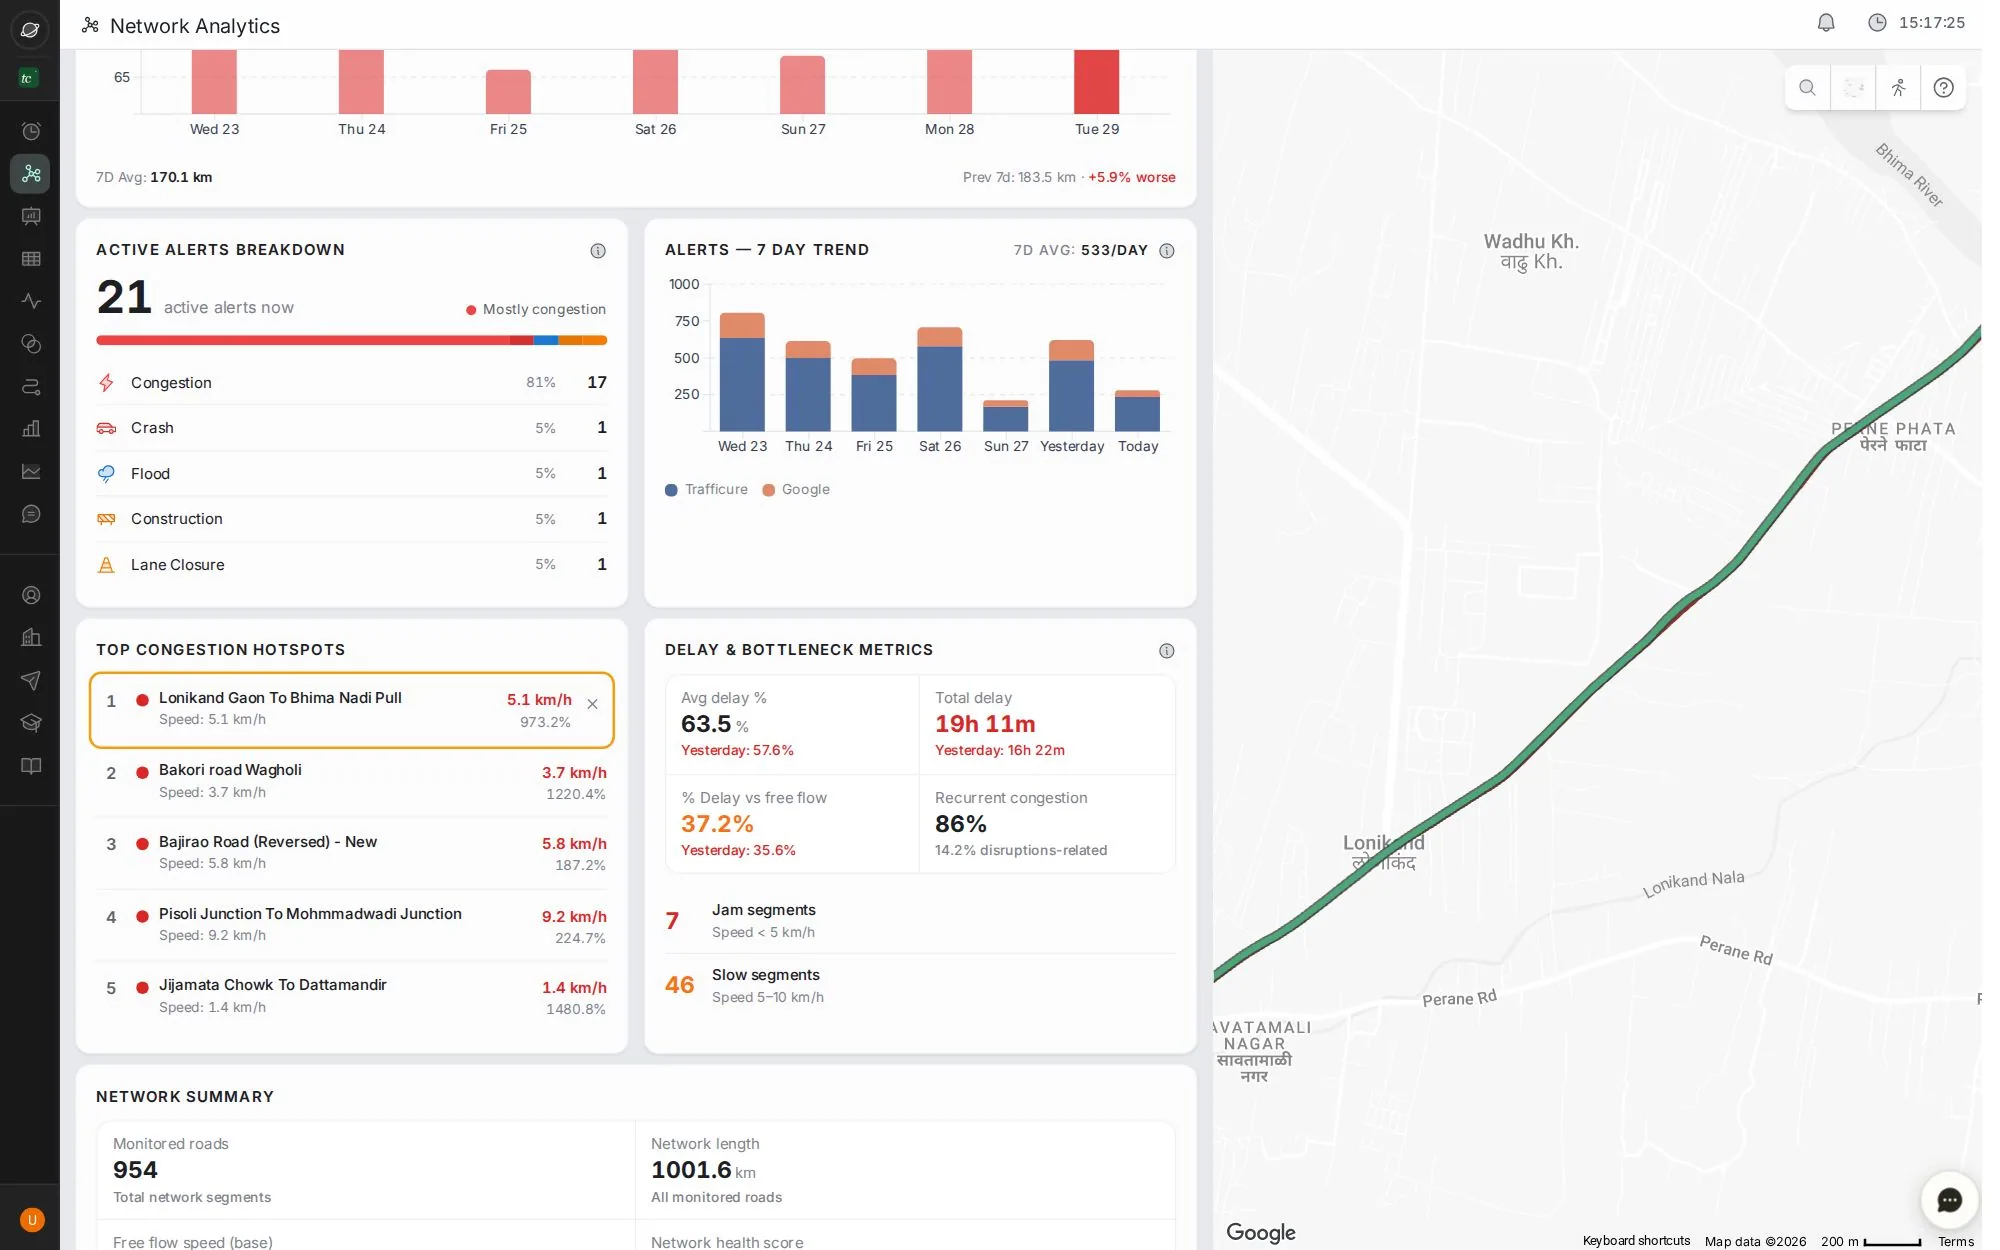
Step 1 of 5 · look
Read the headline numbers
Average speed, travel time index, congested km and congestion index, each with its curve for today.
Start here every morning: is today better or worse than usual?
Tip: use ← and → keys. Click the screen to zoom.
Next job
See what drivers are reporting
Crashes, floods, closures and construction reported by drivers, grouped into hotspots.
Next jobFind the worst area in the city
Rank areas by delay at the evening peak, check it repeats, and generate the report.
Every buttonNetwork Analytics screen
The whole city on one screen: headline numbers, reliability, peaks, alerts and hotspots.
Verified in the live app · 29 Sept 2026 Screens from a live city workspace. Your city will look different.