
Reports turns the platform’s data into documents you can hand over. TraffiCure writes several reports automatically; you can also request a comparison between two periods, or a report on a corridor, segment, area, junction or route with the “Generate Report” button in its detail panel.
Types of report
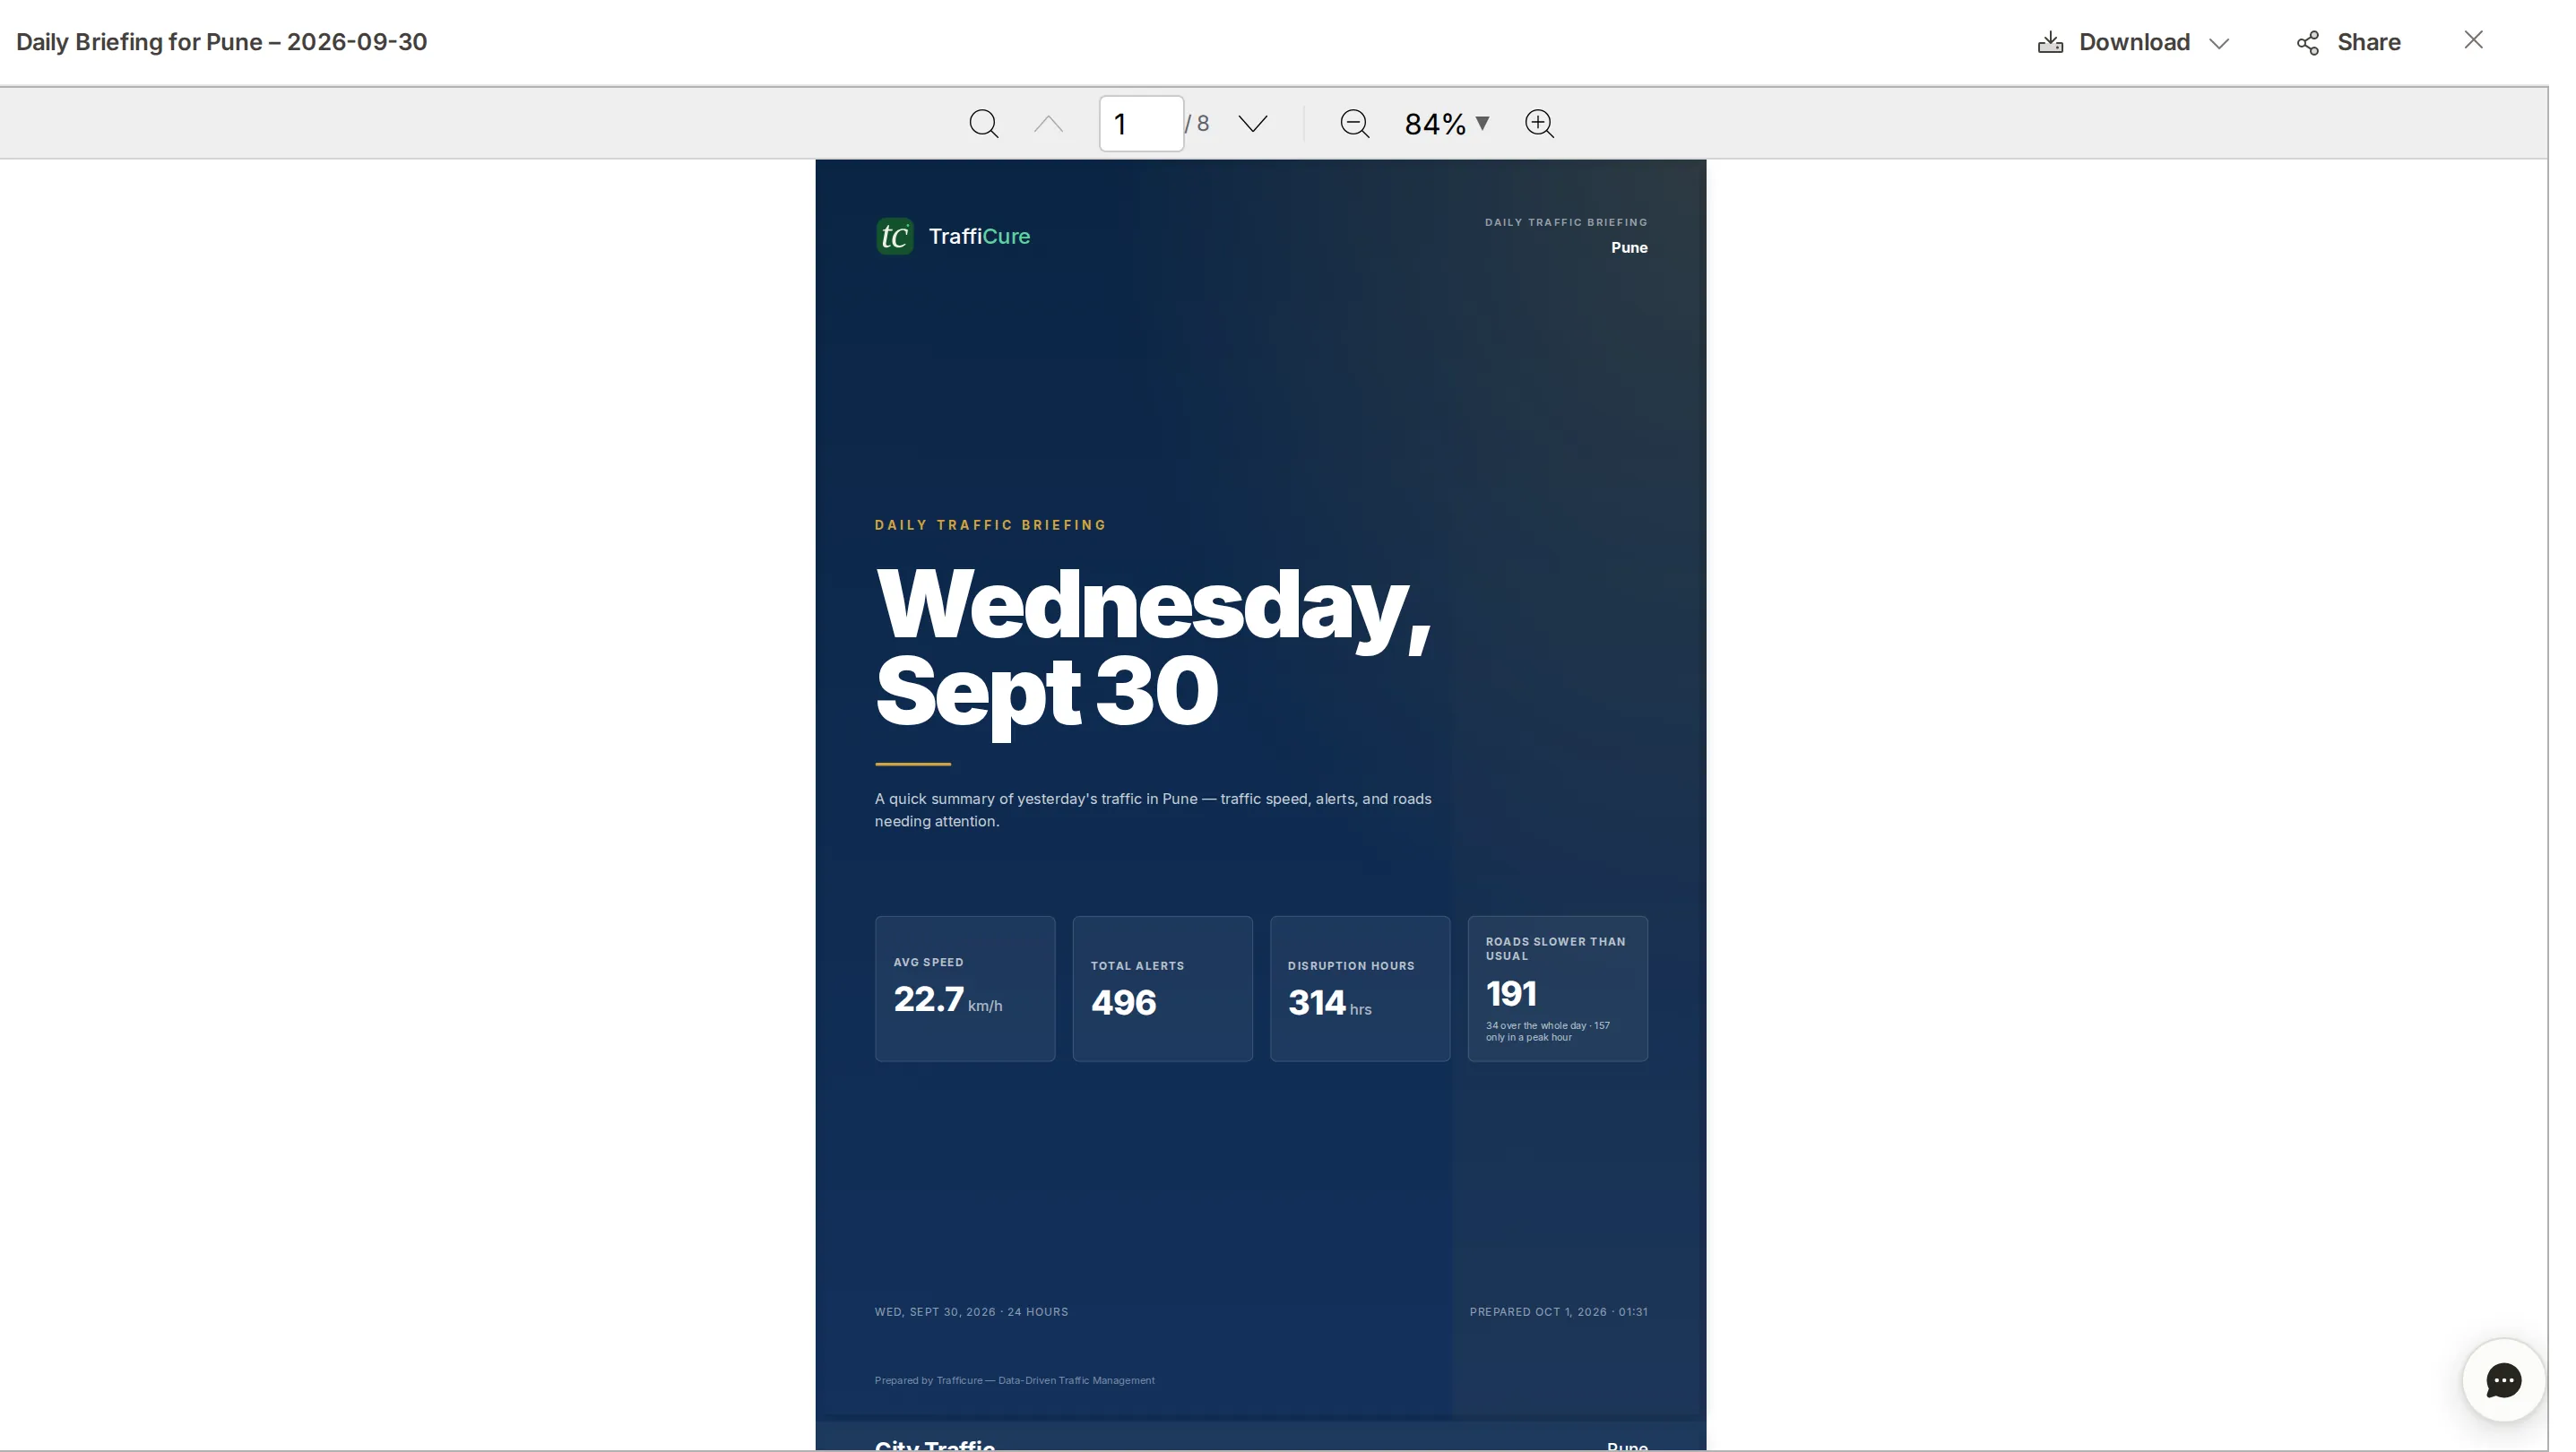
- Daily Briefing: every morning, a summary of yesterday over several pages: average speed, total alerts, disruption hours and the roads that were slower than usual.
- Congestion Daily: every day, yesterday’s congestion and surge alerts, with the start and end time, duration and road of each. Other daily reports cover the top 32 roads, all junctions and all divisions.
- Weekly reports (the “Weekly” tab): every week, how the headline numbers moved against the week before, the ranking of congestion hotspots, and reliability trends.
- Monthly reports (the “Monthly” tab): at the start of each month, a summary for leadership, such as “Monthly Leadership”, with long-term trends and the change in the headline numbers.
- On-demand: comparisons between two periods, and the reports requested from the detail panels of corridors, segments, areas, junctions and routes.
Finding a report
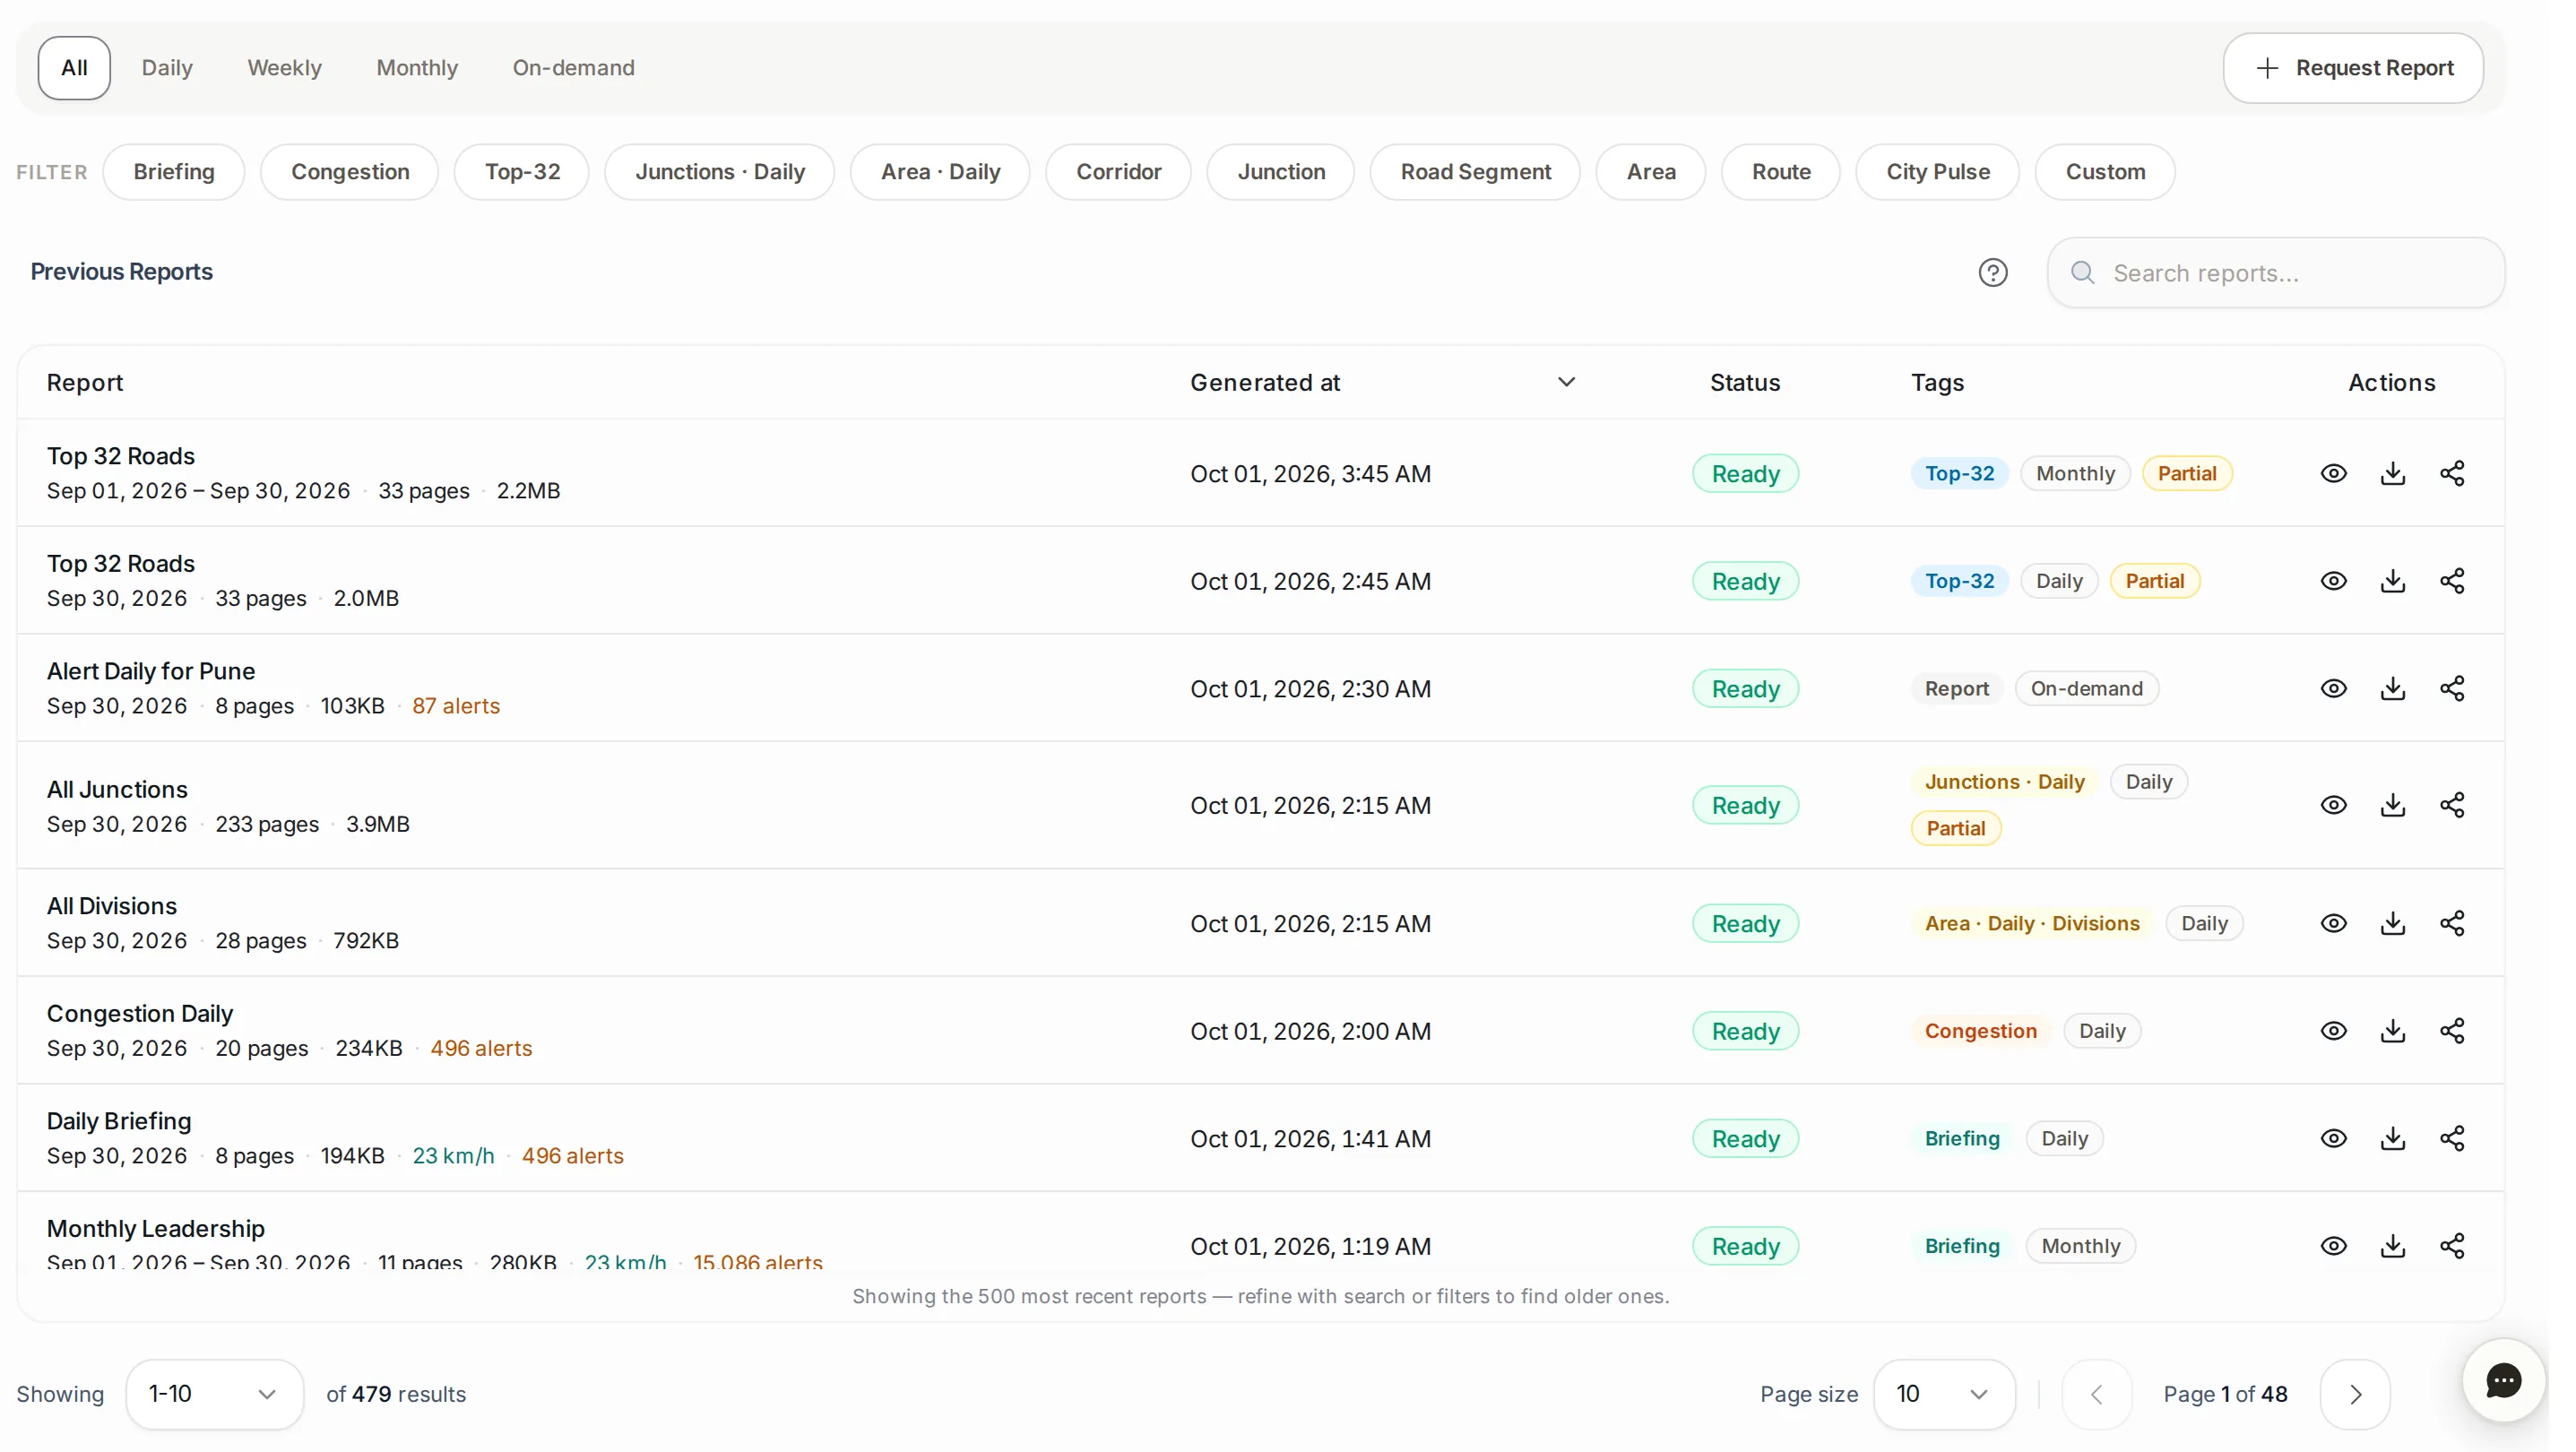
The “Previous Reports” table lists every report TraffiCure has produced. Filter it by type with the tabs at the top (“All”, “Daily”, “Weekly”, “Monthly”, “On-demand”), by tag (such as Briefing, Congestion, Top-32, Corridor, Junction, Road Segment, Area and Route), or search by title.
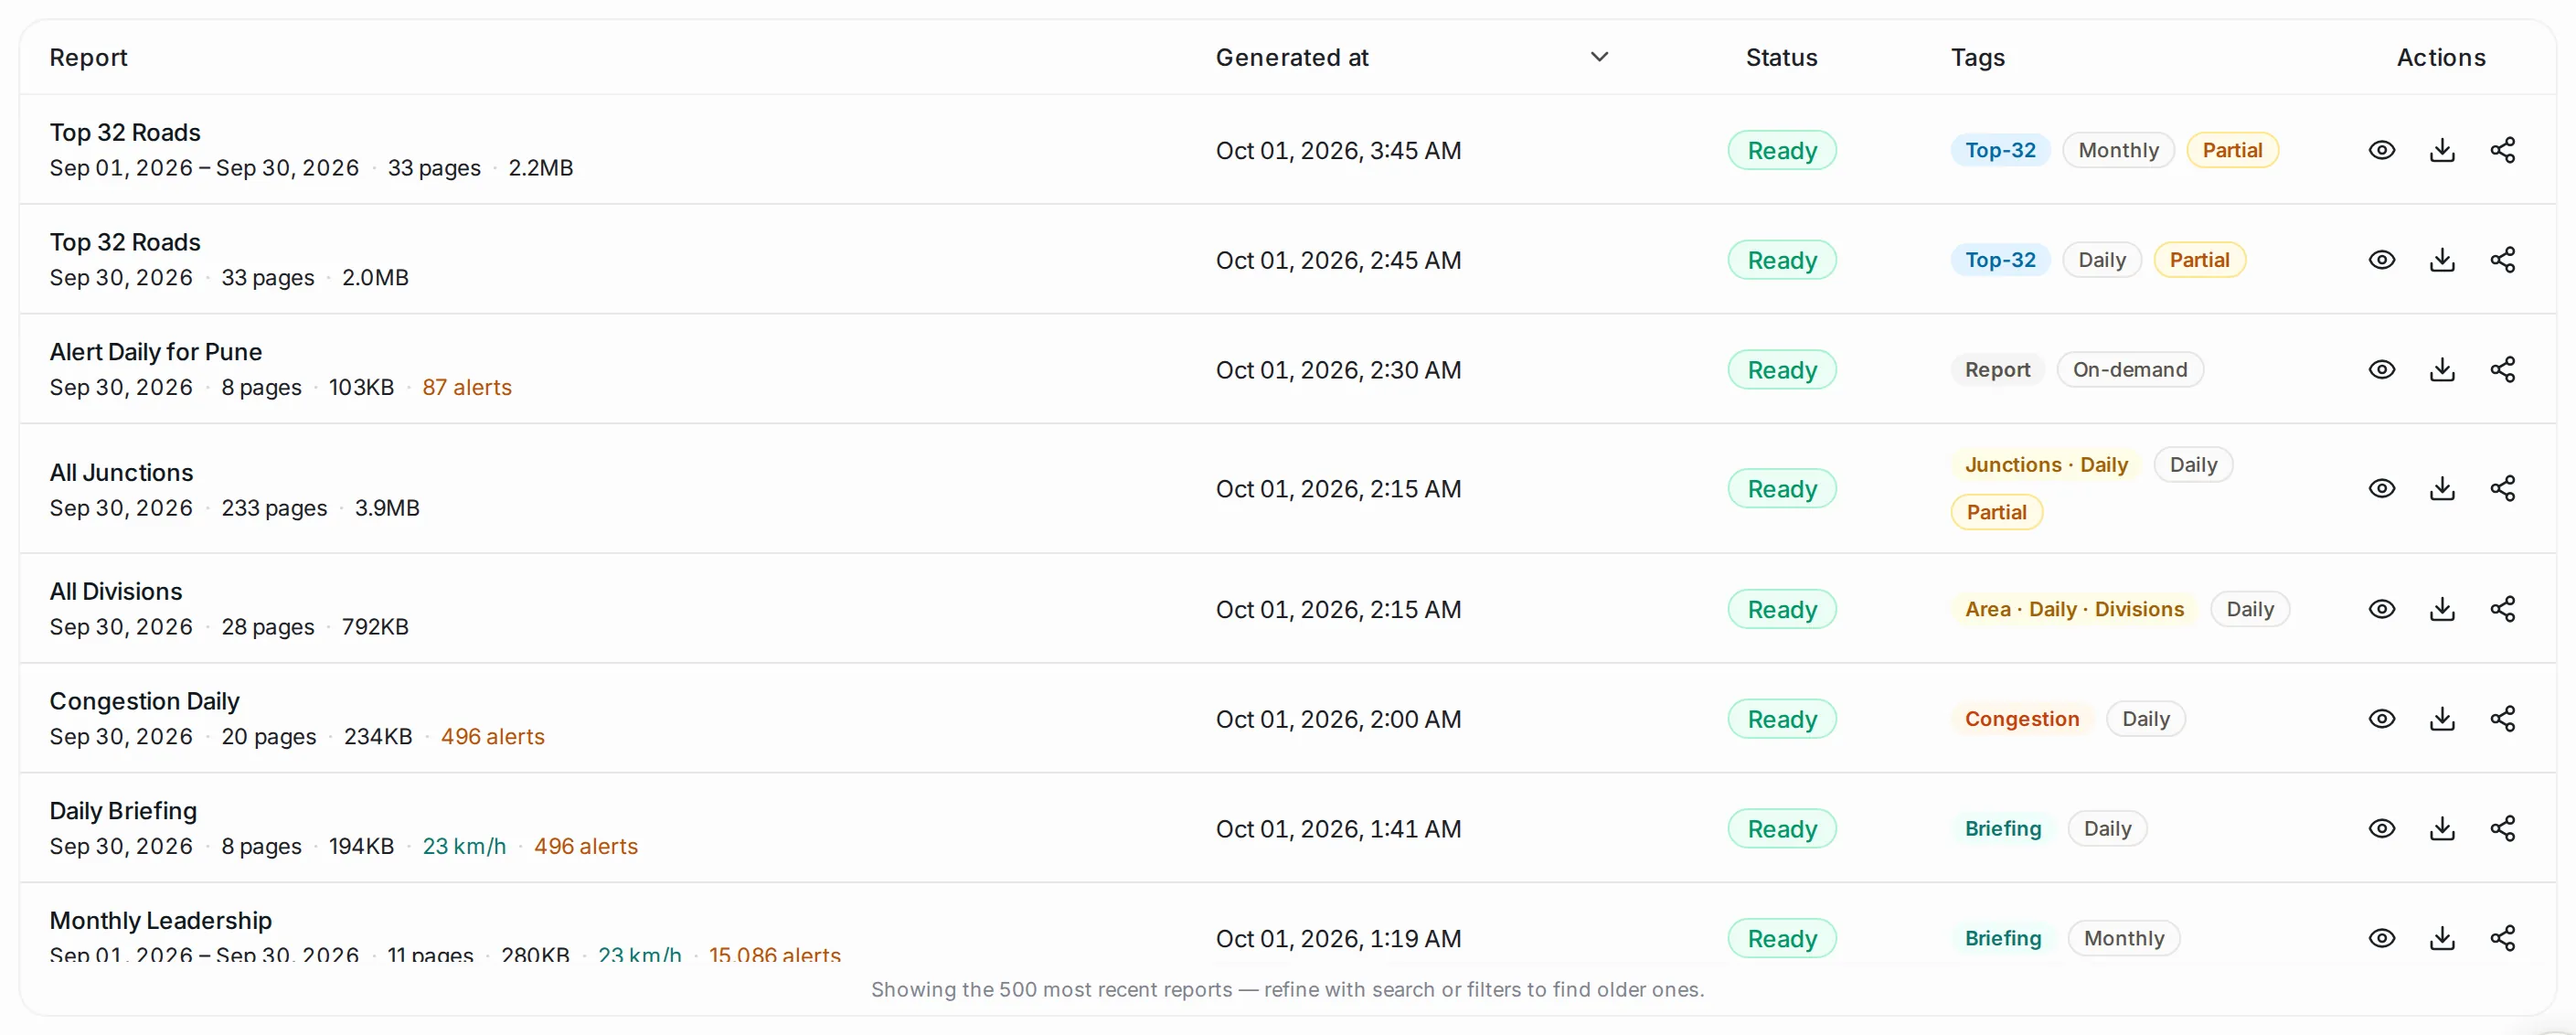
Each row shows the report’s title, the period it covers, its page count and size, figures such as the network speed and the number of alerts, when it was generated, its status (such as “Ready”), its tags, and three actions: view, download and share. The table holds the 500 most recent reports; use the search or the filters to find older ones.
Opening a report
Click the view button to open the report: the PDF appears in the page, with page navigation, zoom and search, and you can download or share it from the top.
Requesting a comparison report
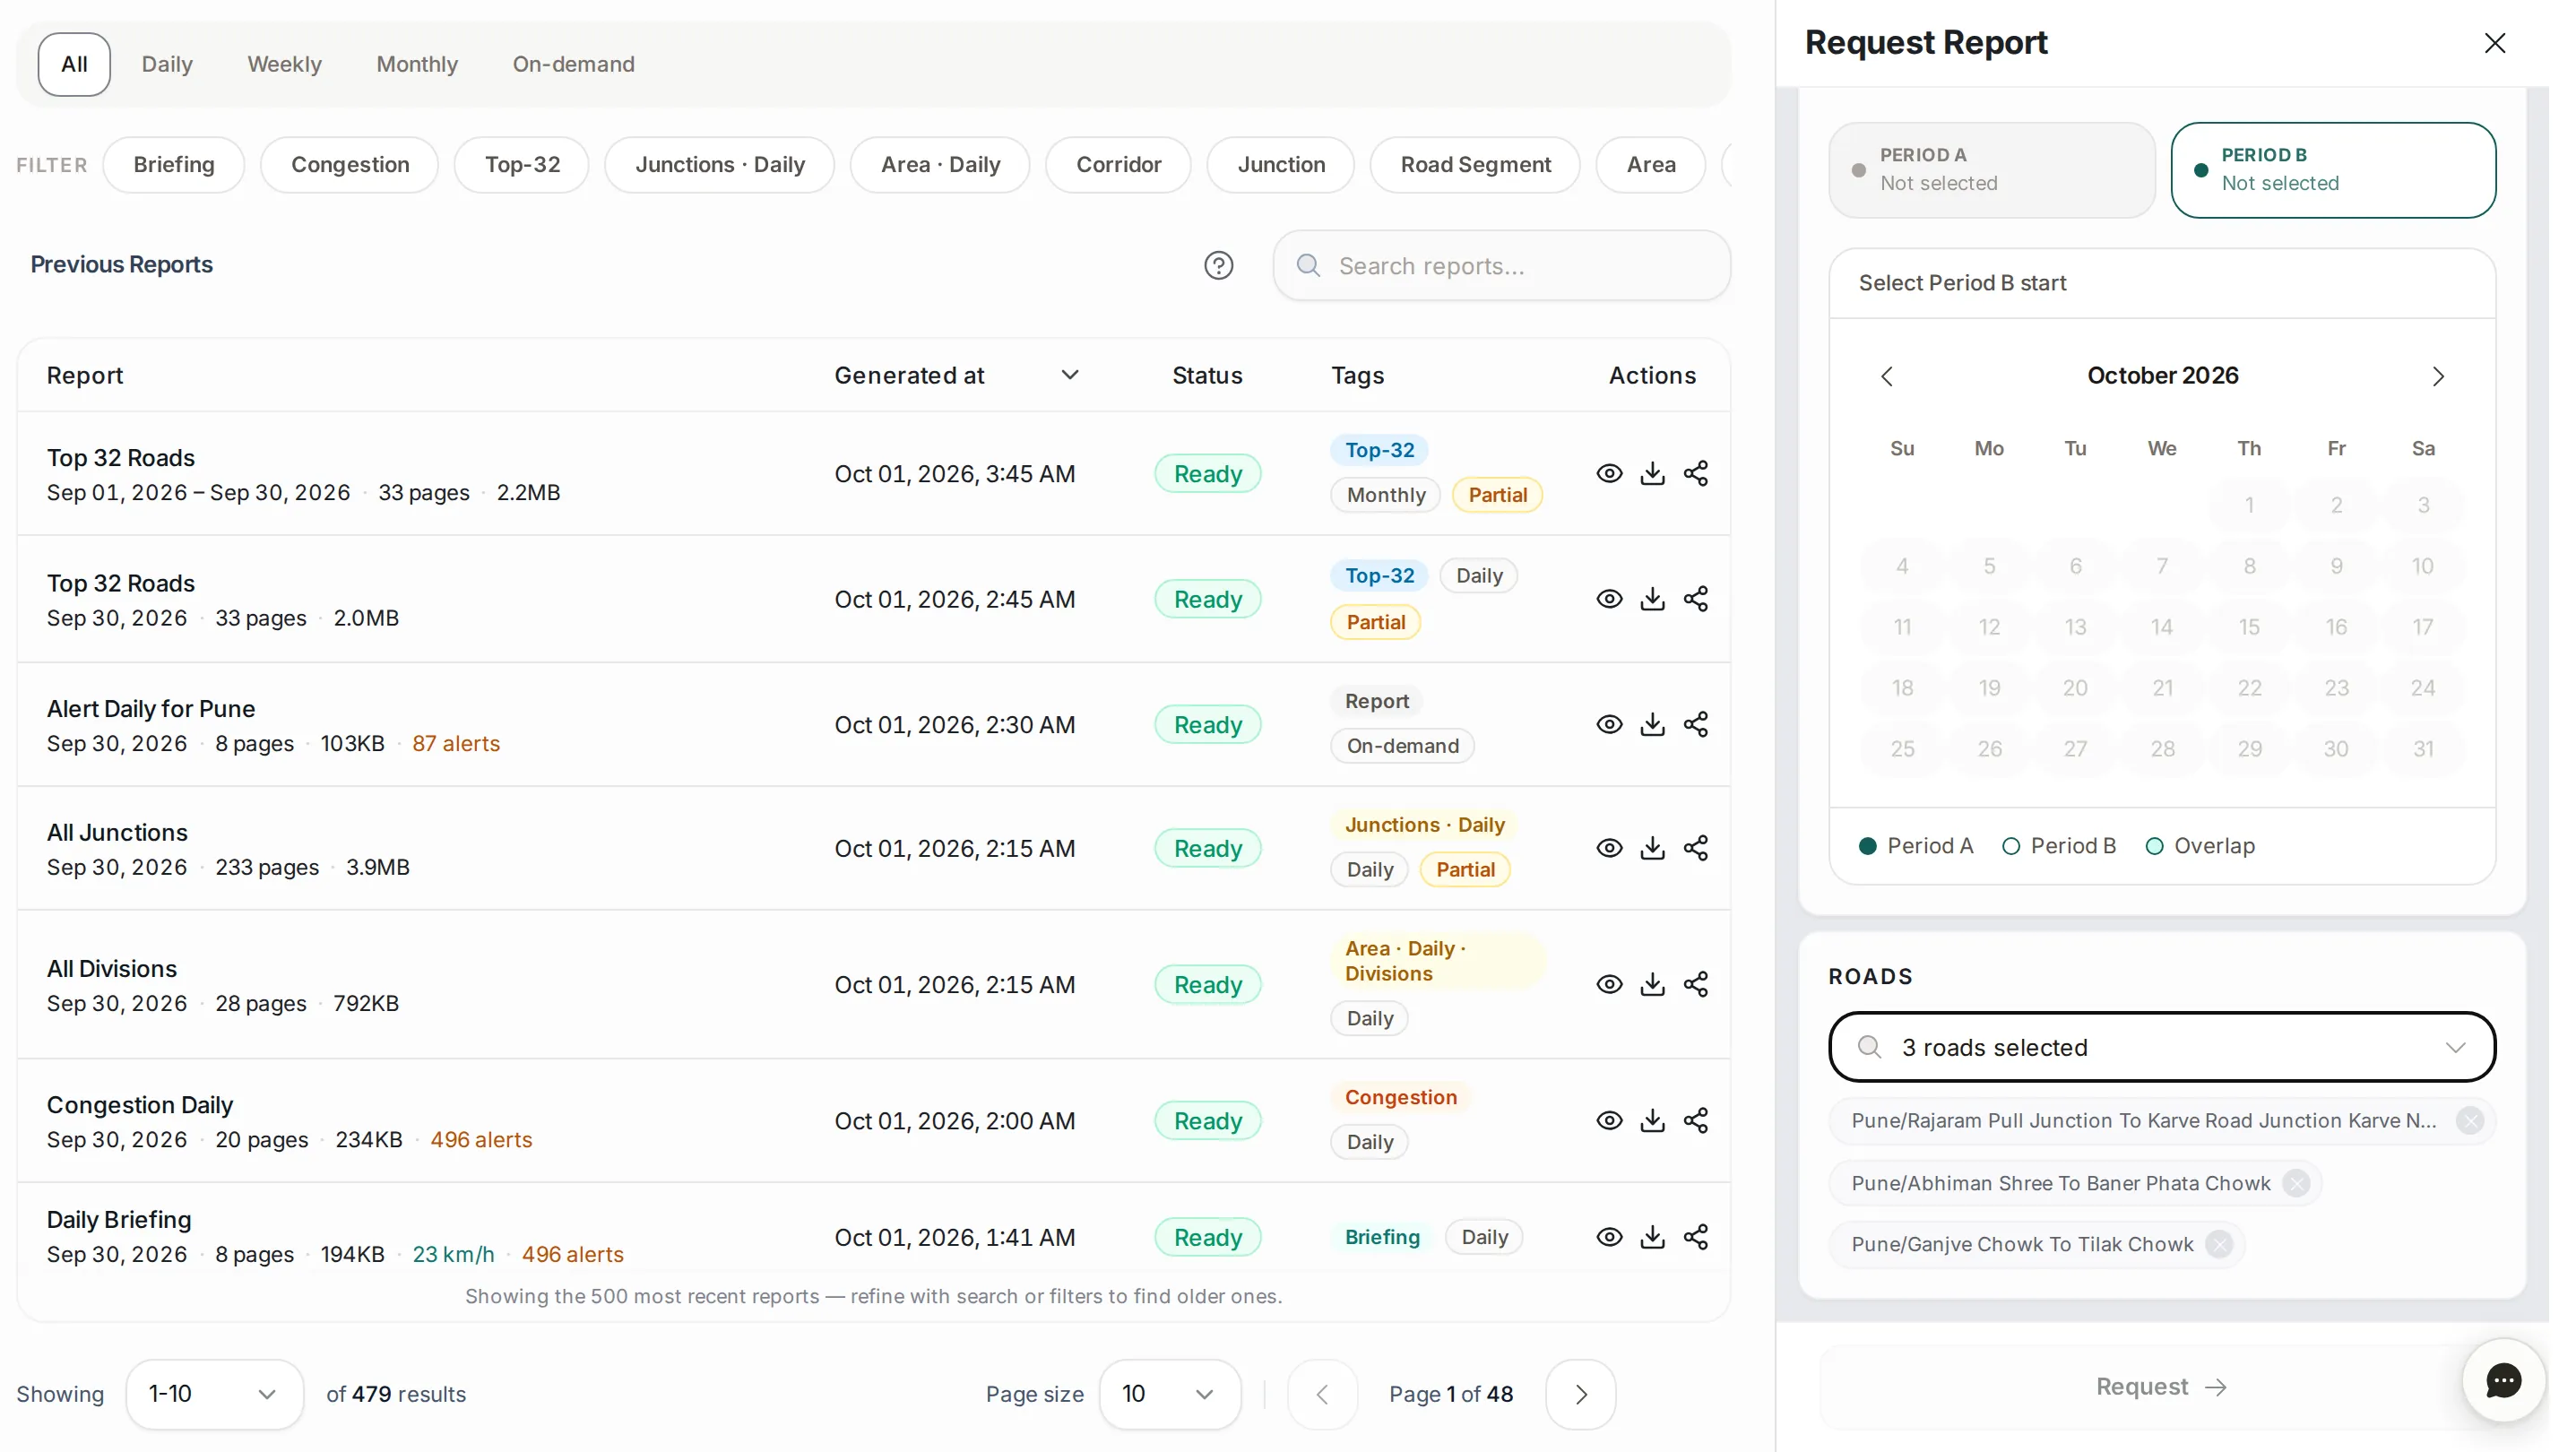
For a custom comparison, click “Request Report”. Name the report, pick two periods on the calendar (Period A and Period B), add the roads you want to compare (up to 12) with “Search and add roads…”, then click “Request”. TraffiCure builds the report in the background and adds it to the list when it is ready.
Common workflows
- Morning routine: open today’s daily briefing and skim it in two minutes before the morning meeting.
- Weekly update for management: share the weekly report with your director, using the share button.
- Monthly pack for the board: download the monthly report and add it to your presentation.
- Check whether an intervention worked: request a comparison between the week before a project and the week after it, to measure its effect.
- A report on one road: open the corridor or segment in Analytics and click “Generate Report”.
Who it’s for
- Operations directors who start the day with the daily briefing.
- Heads of department following the week with the weekly report.
- Senior leadership reading the monthly reports.
- Project owners running before-and-after comparisons.
Related modules
The numbers in your reports come from Network Analytics and Analytics; open either to see them live and dig deeper than a PDF allows.
The screen at a glance
Every report TraffiCure writes, plus the ones you generate and request. Hover a number to find it on the screen.
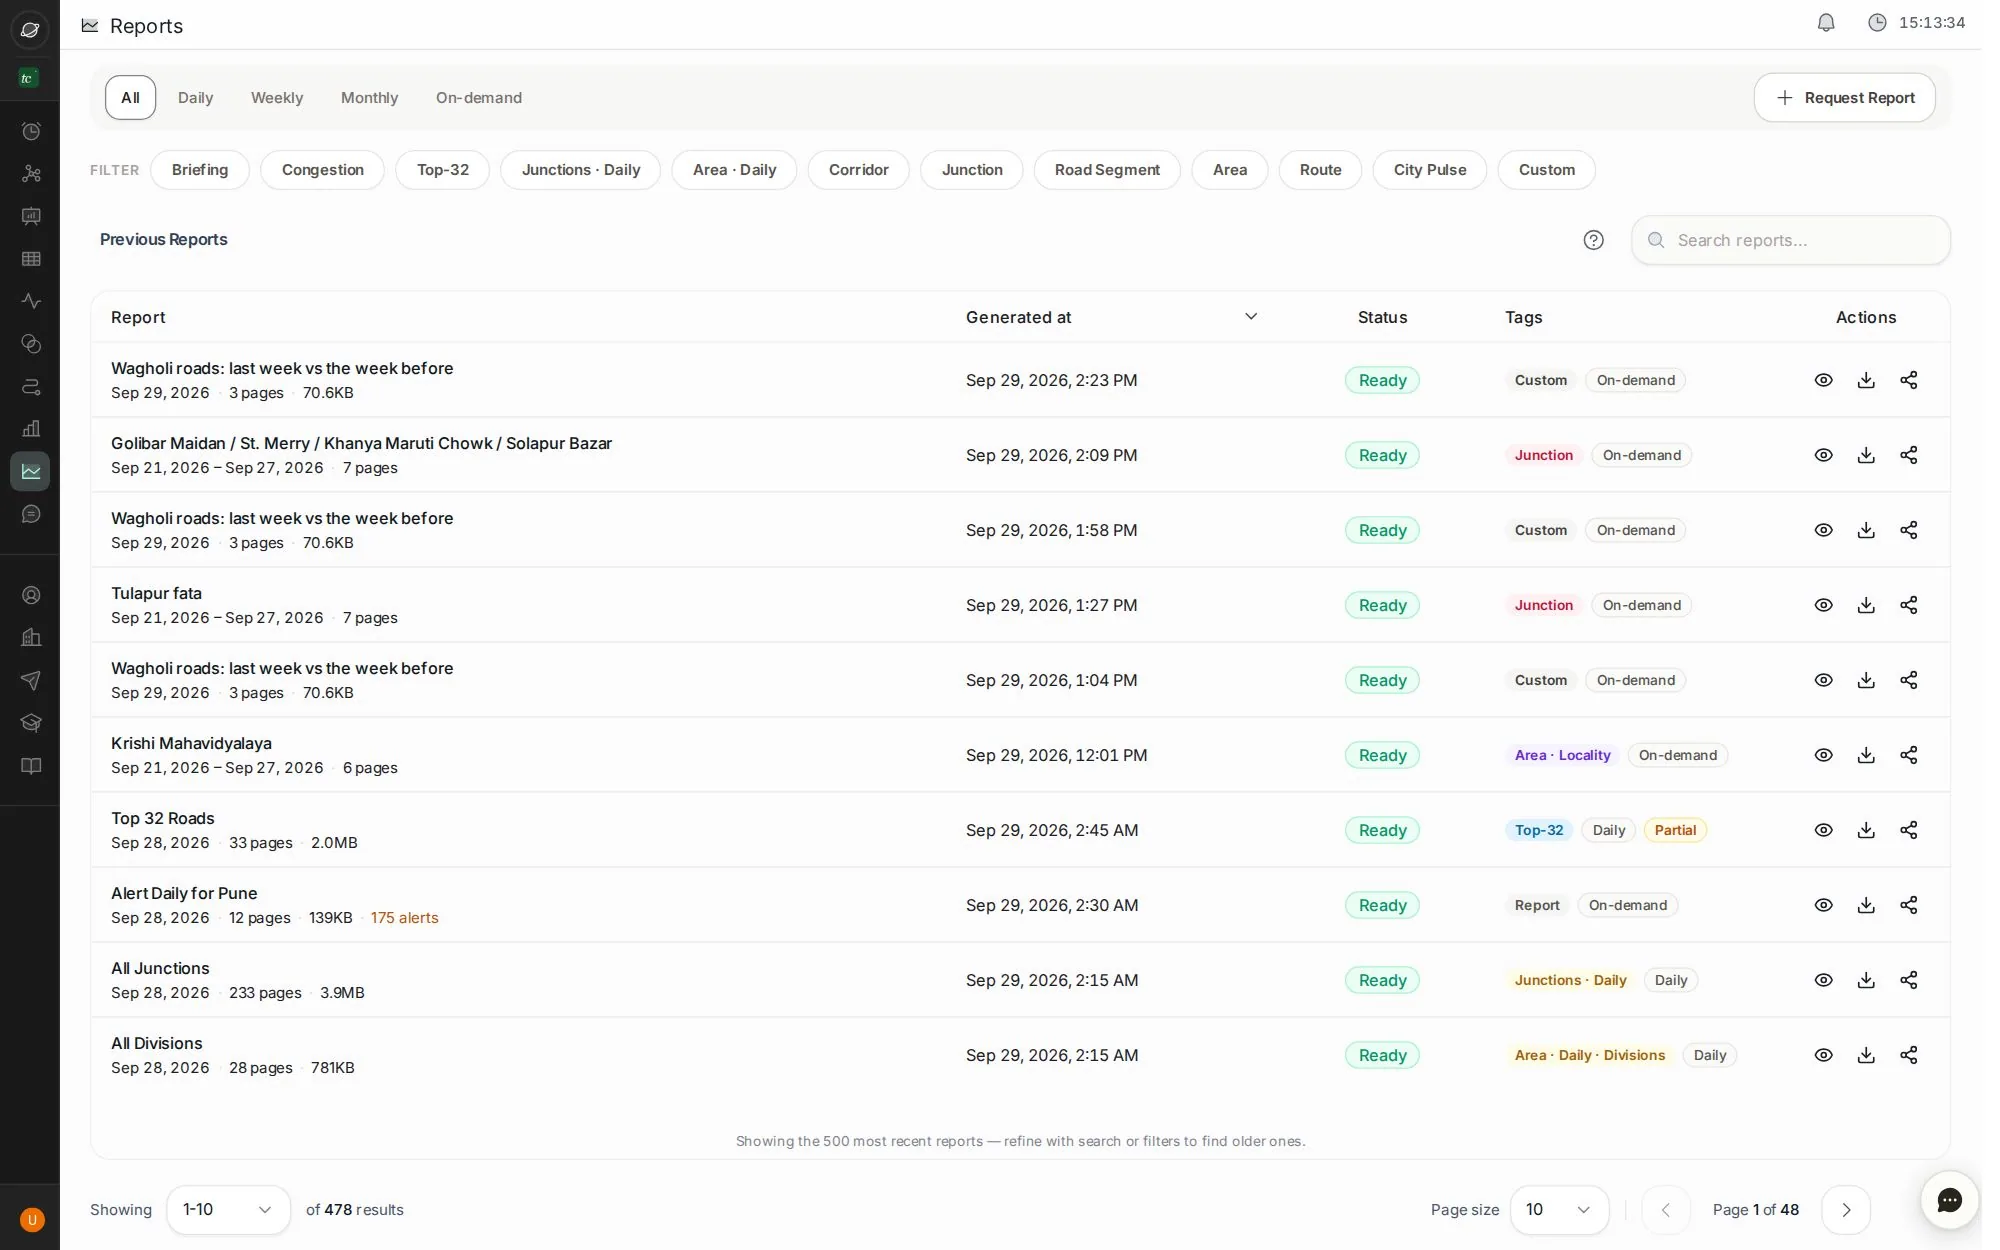
- 1Daily, weekly, monthly or on-demand
- 2Filter by report type
- 3Search the archive
- 4A report: dates, pages, size and status
- 5View, download or share
- 6Request a before-and-after comparison
Step by step
Guides that walk you through this module in the live app, one click at a time.