
This week · Area Analysis
Find the worst area in the city
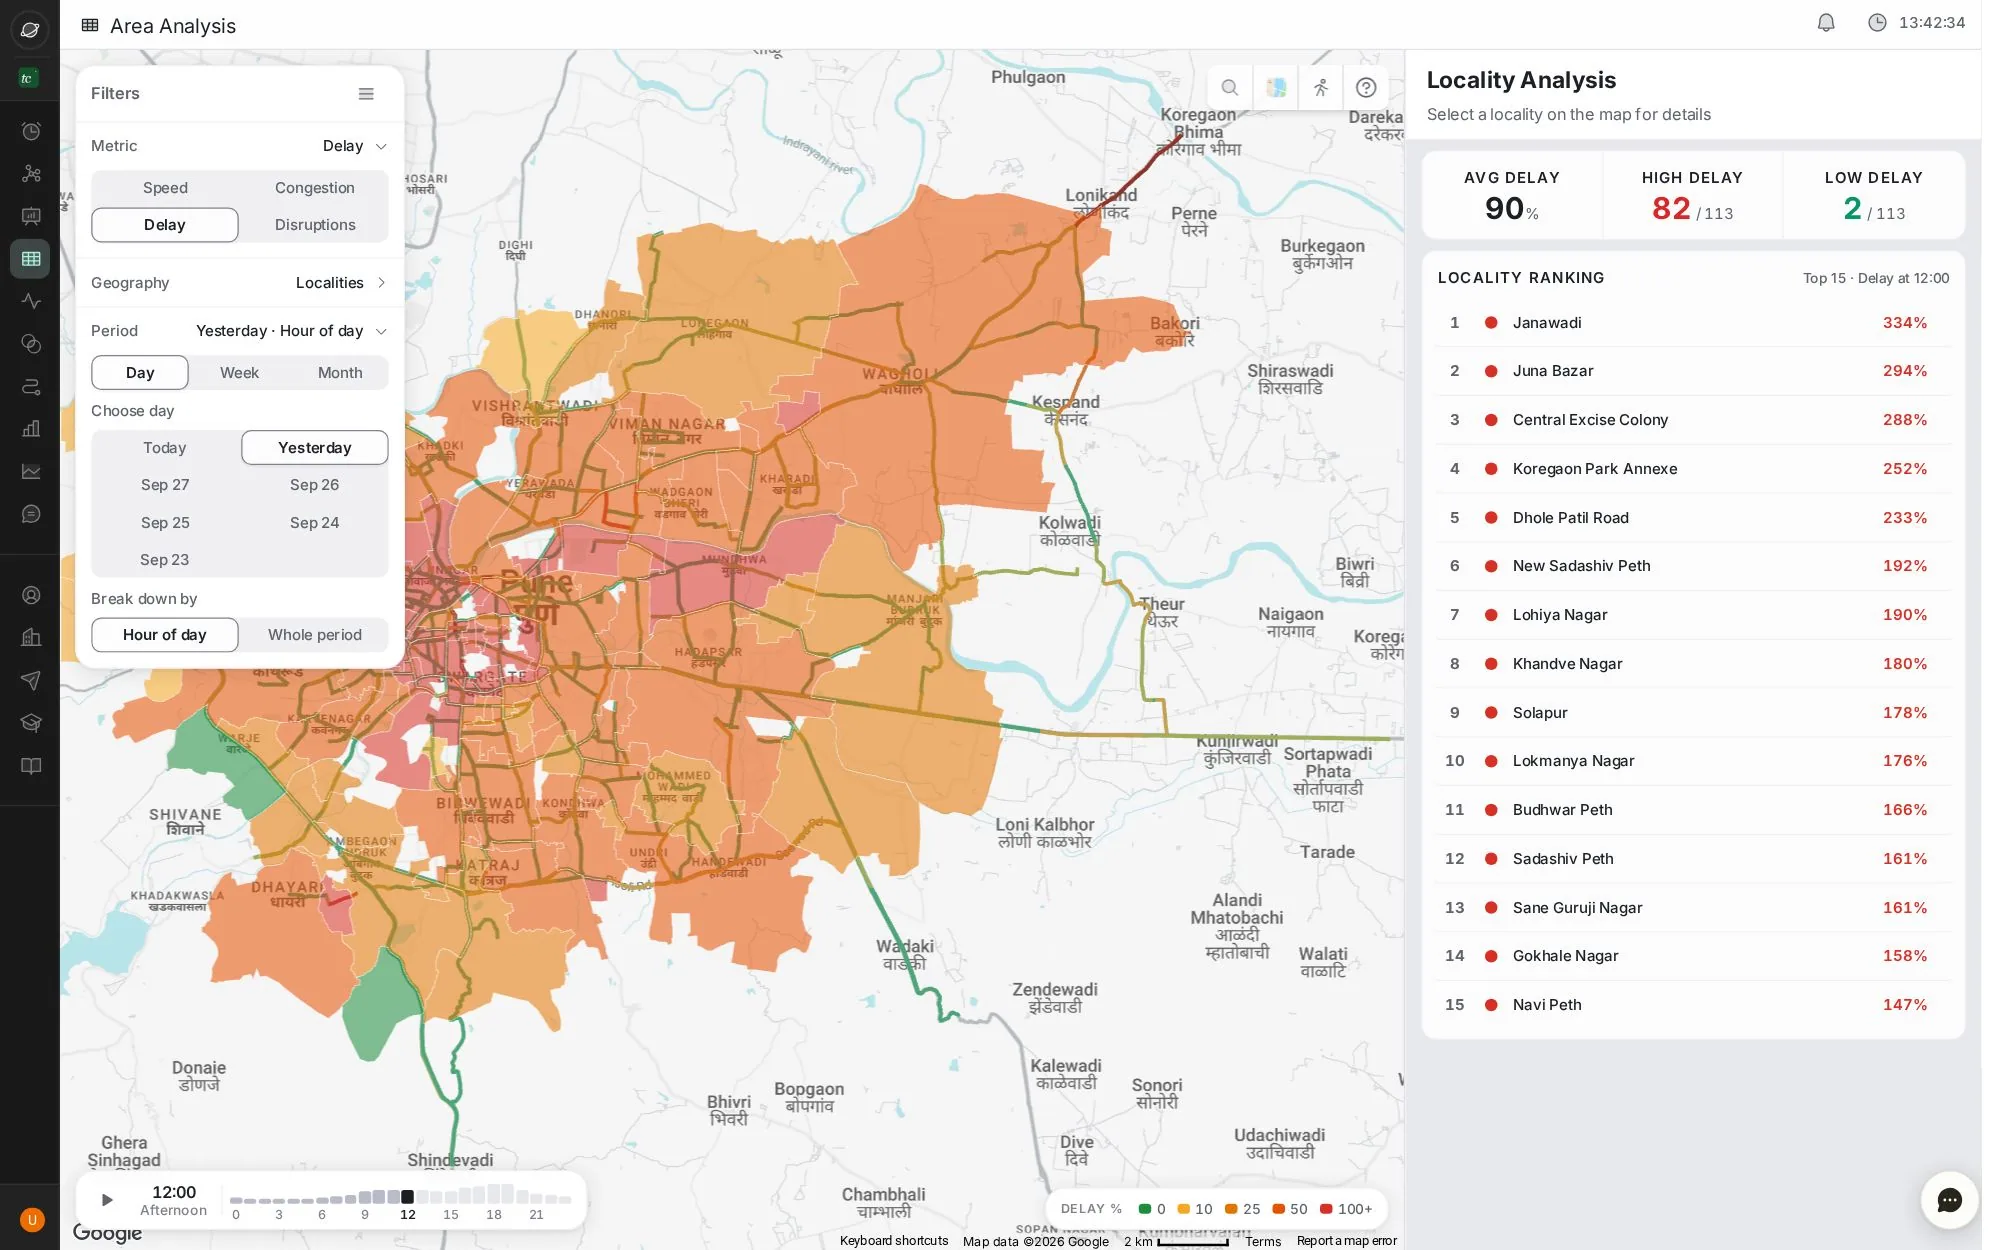
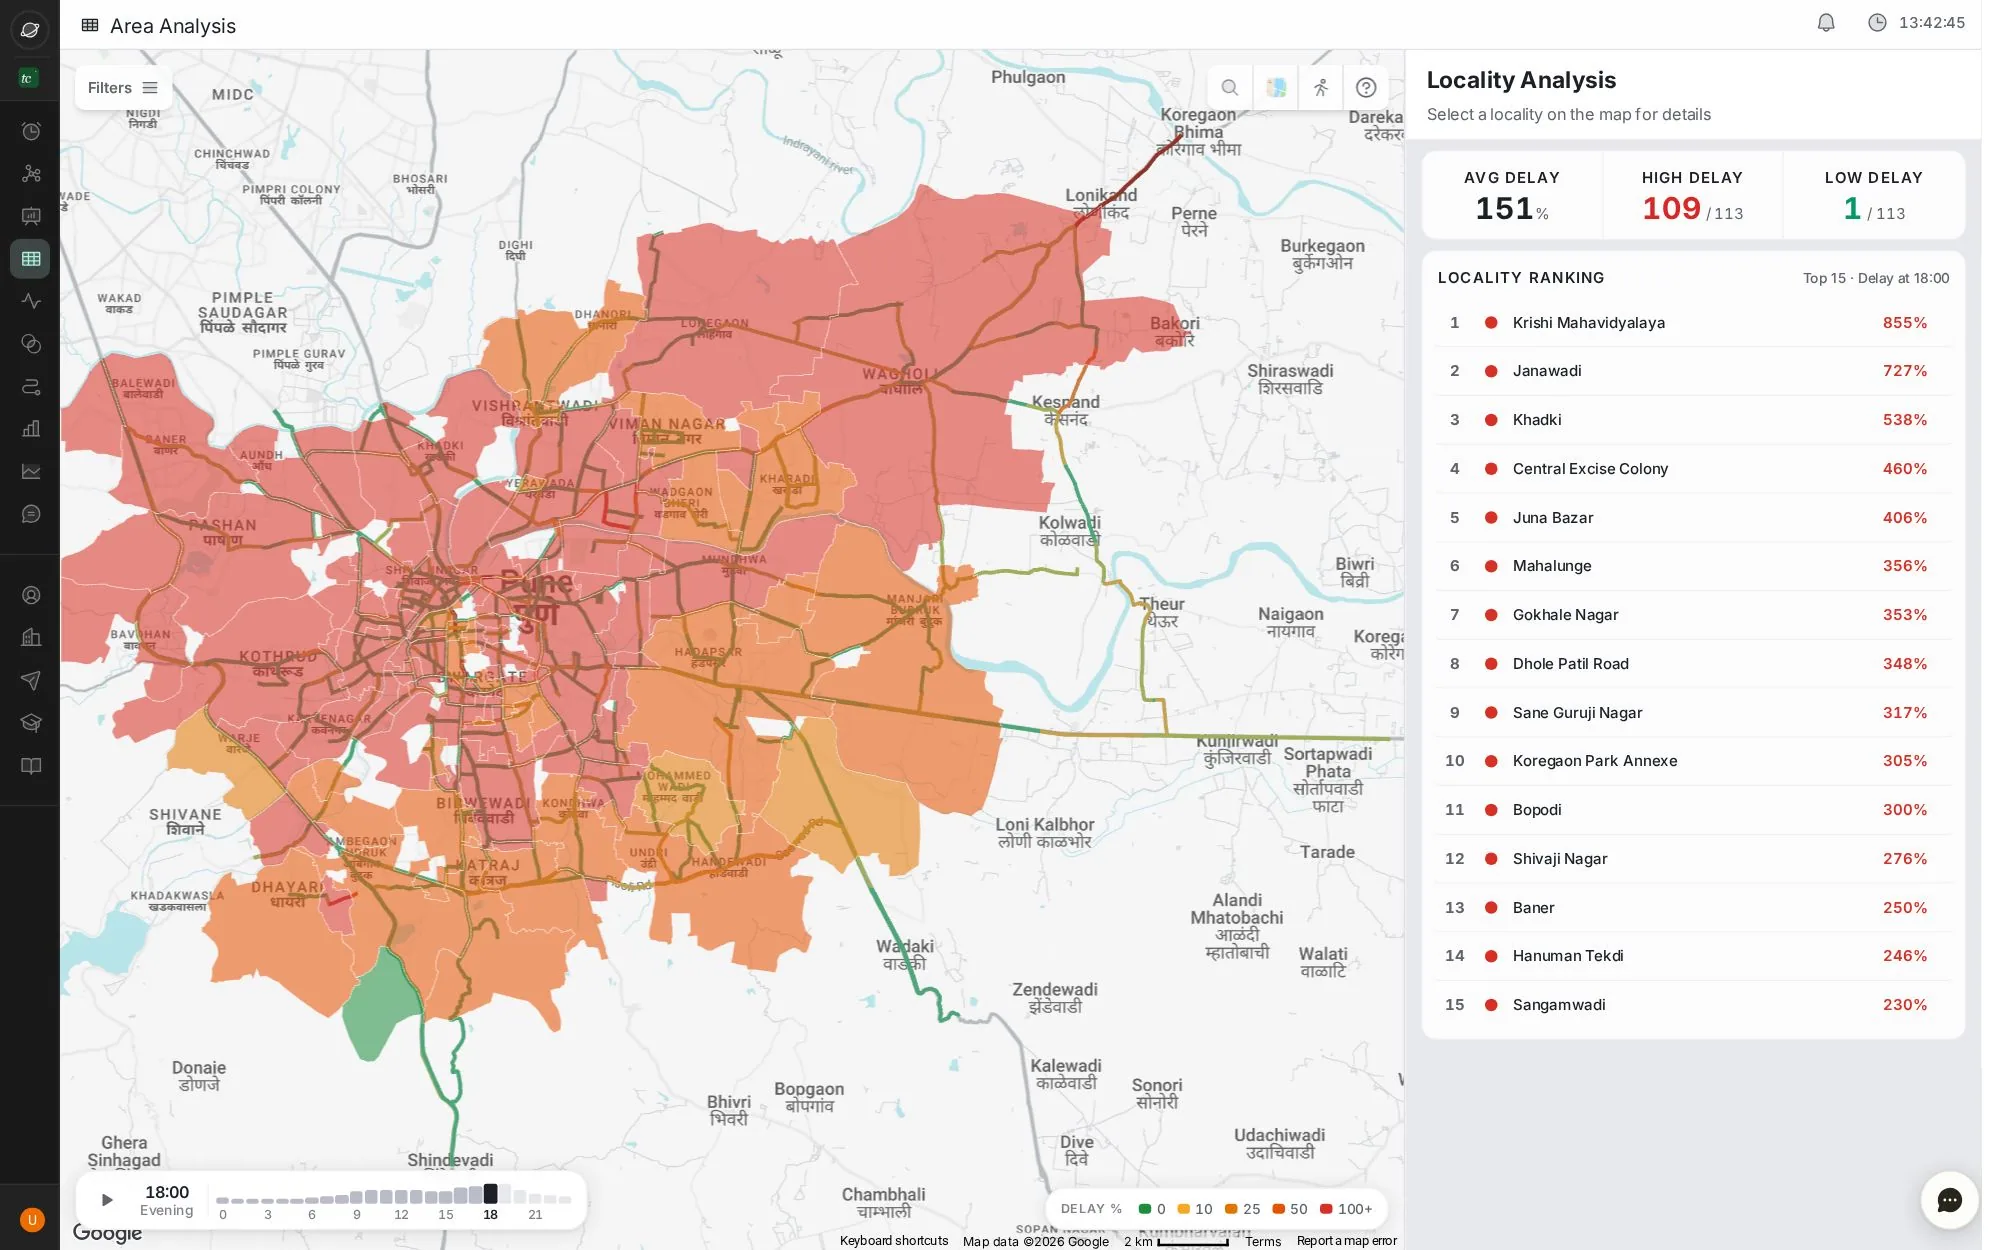
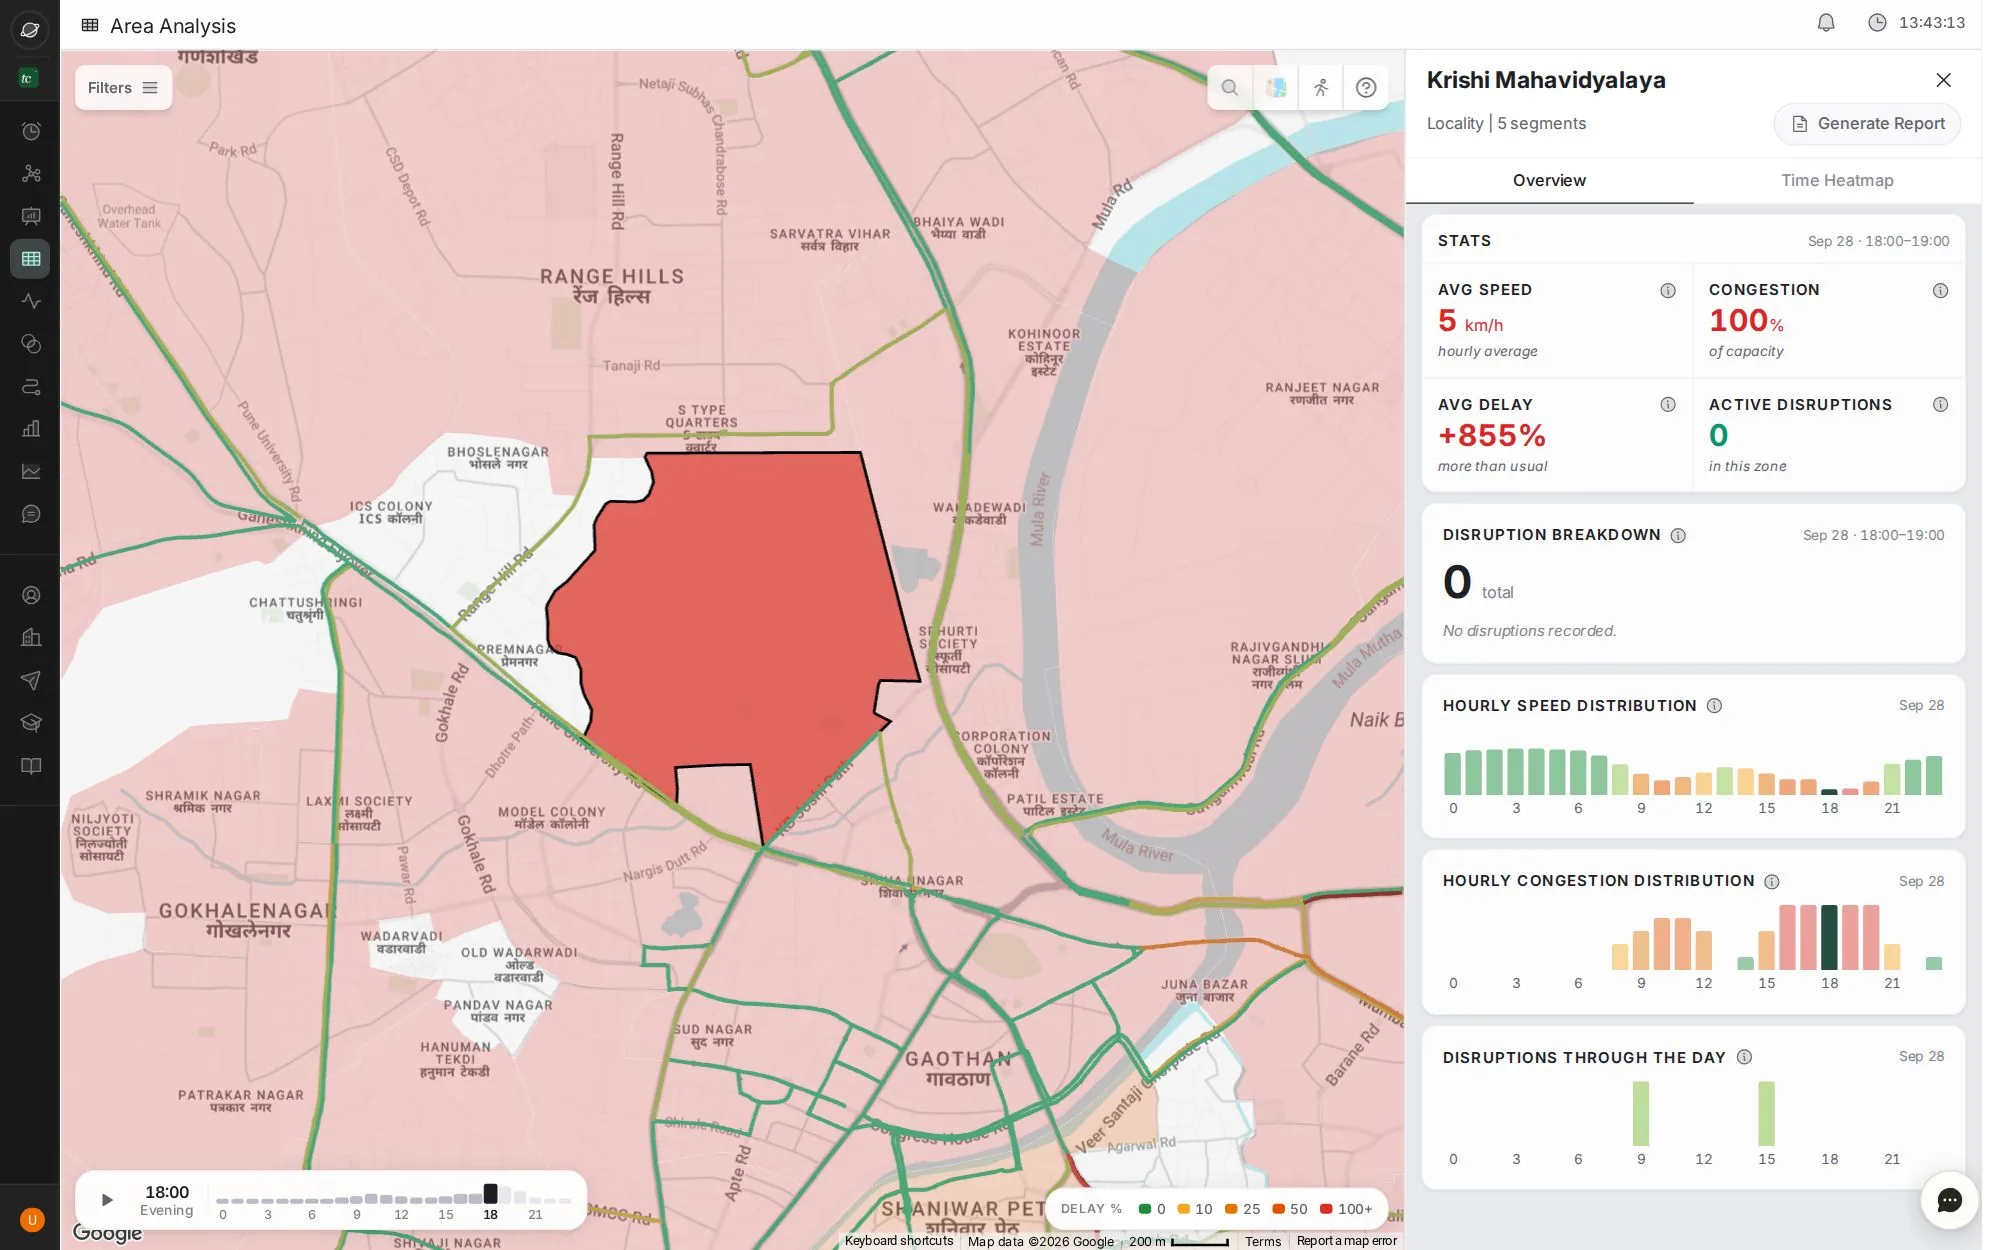
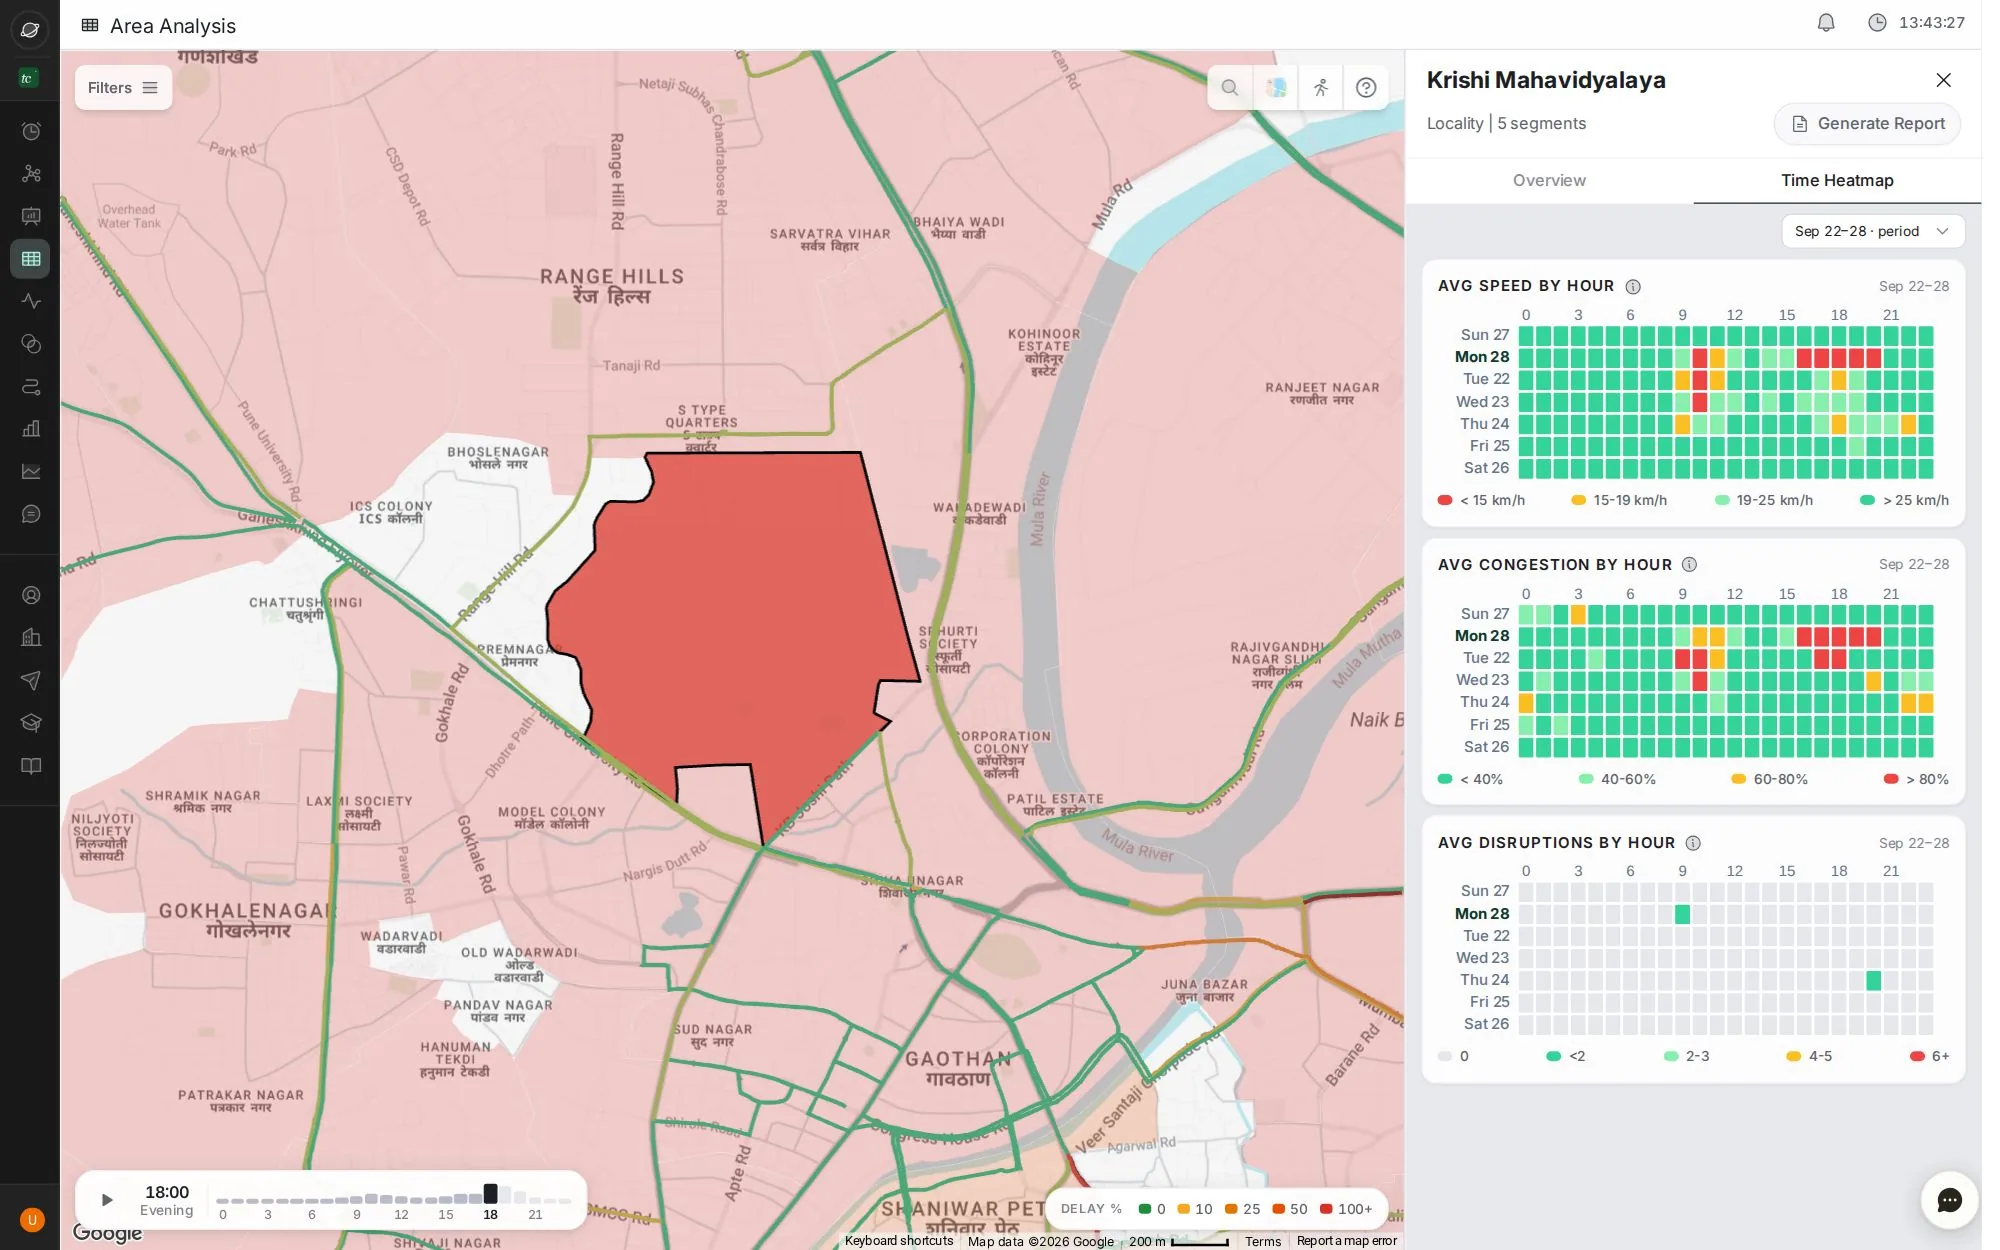
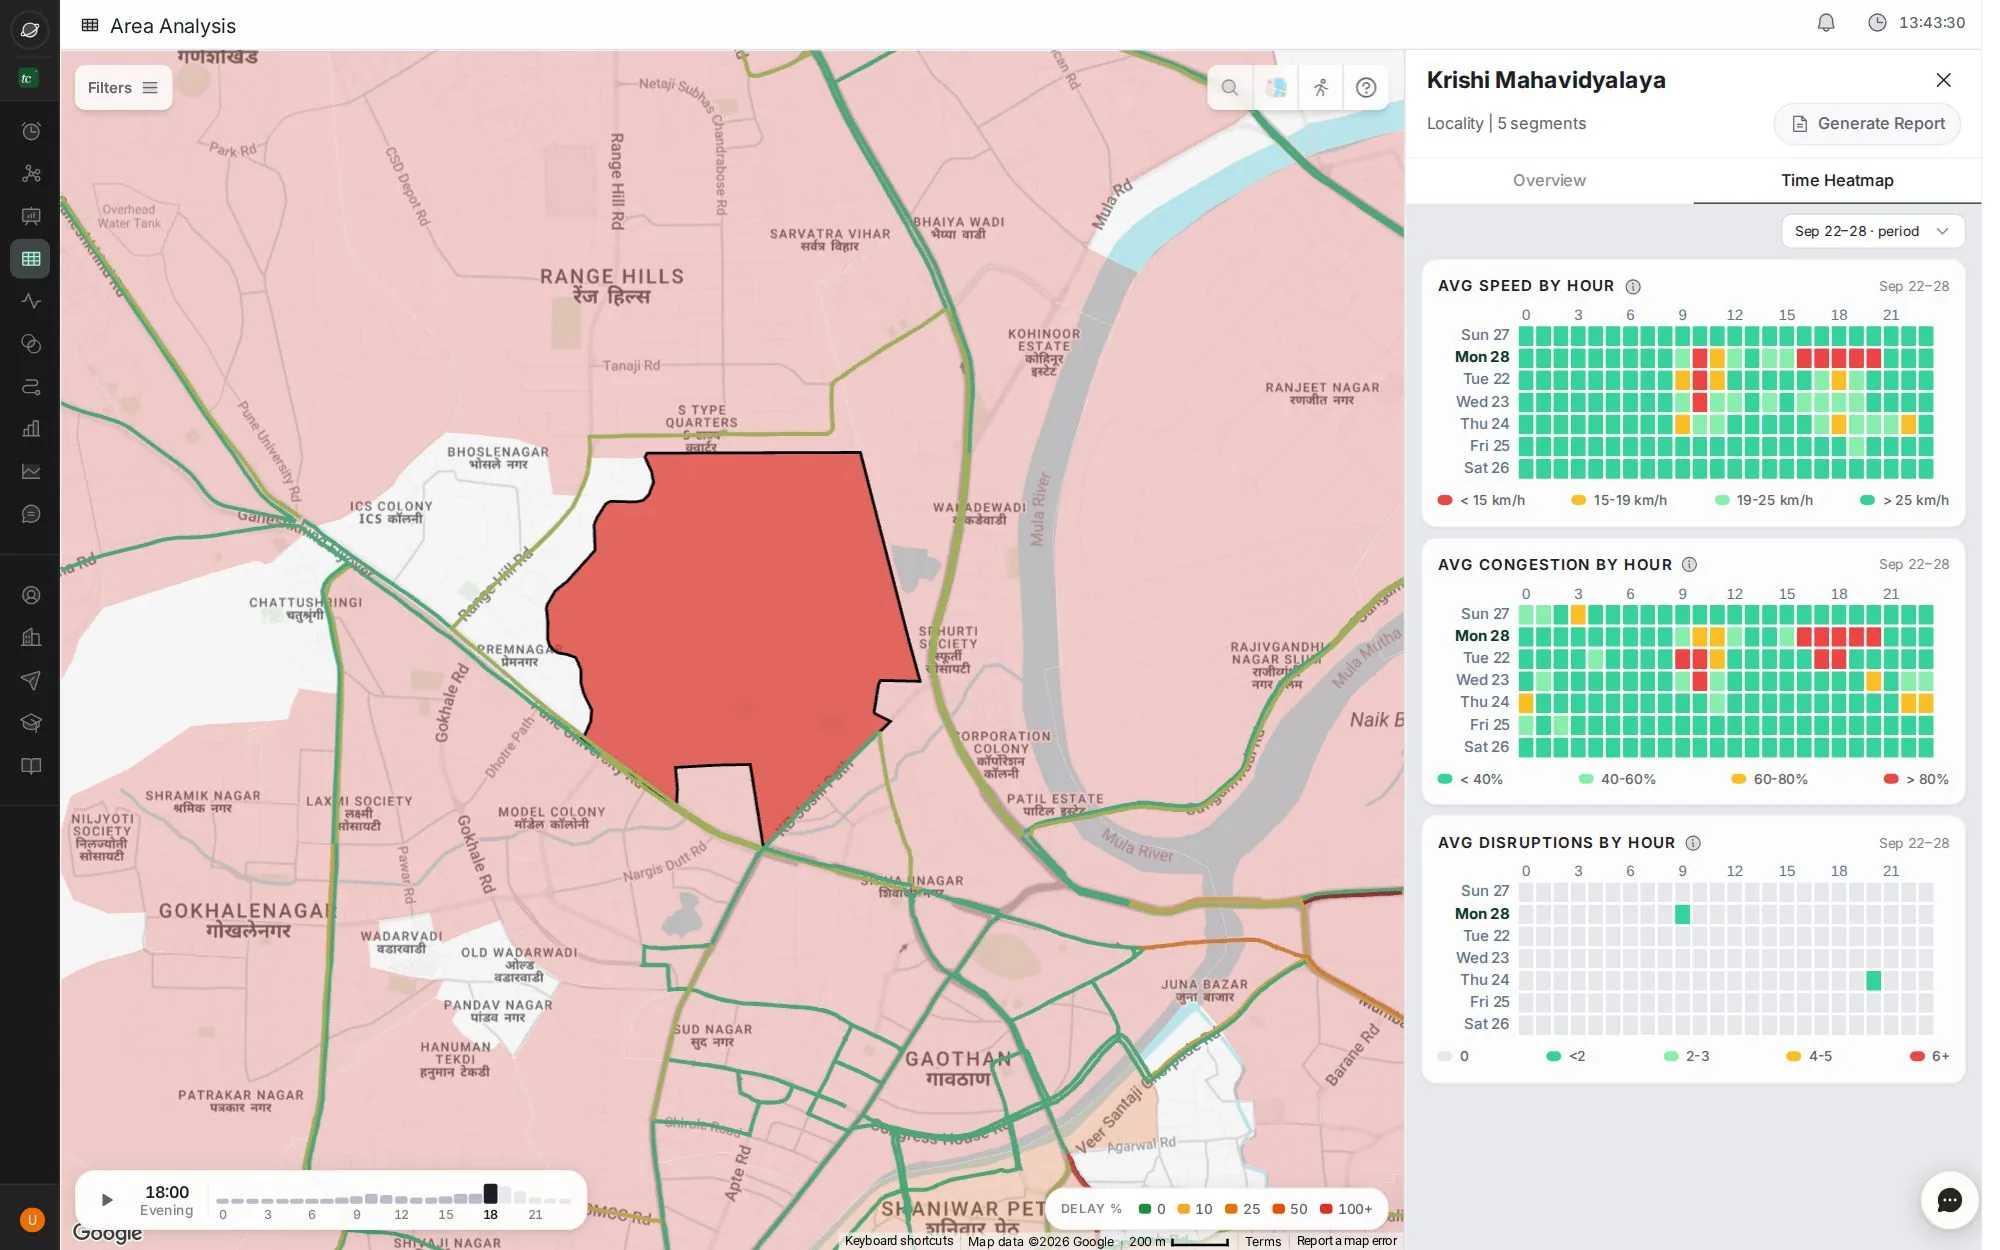
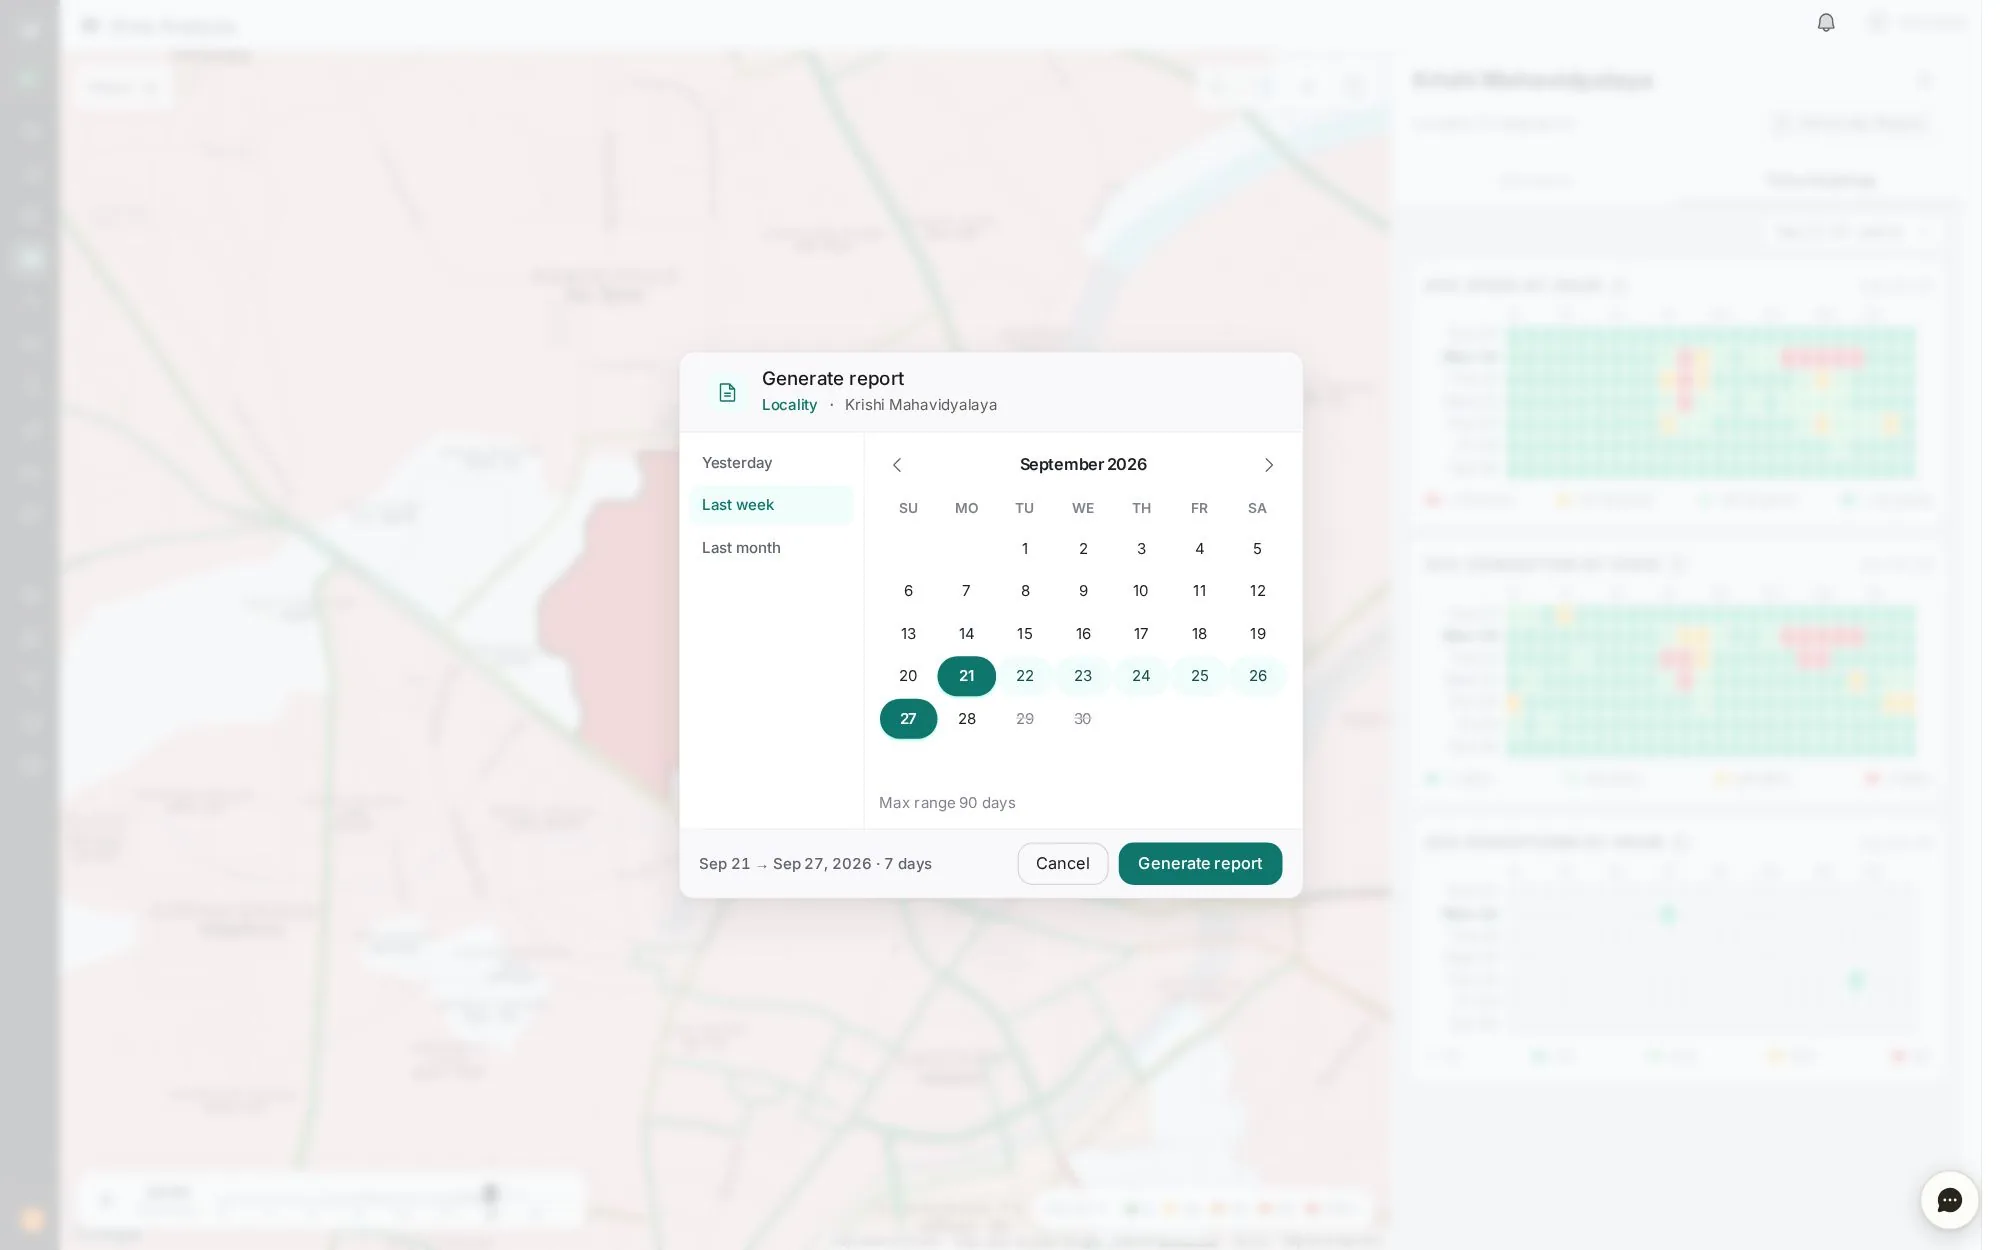
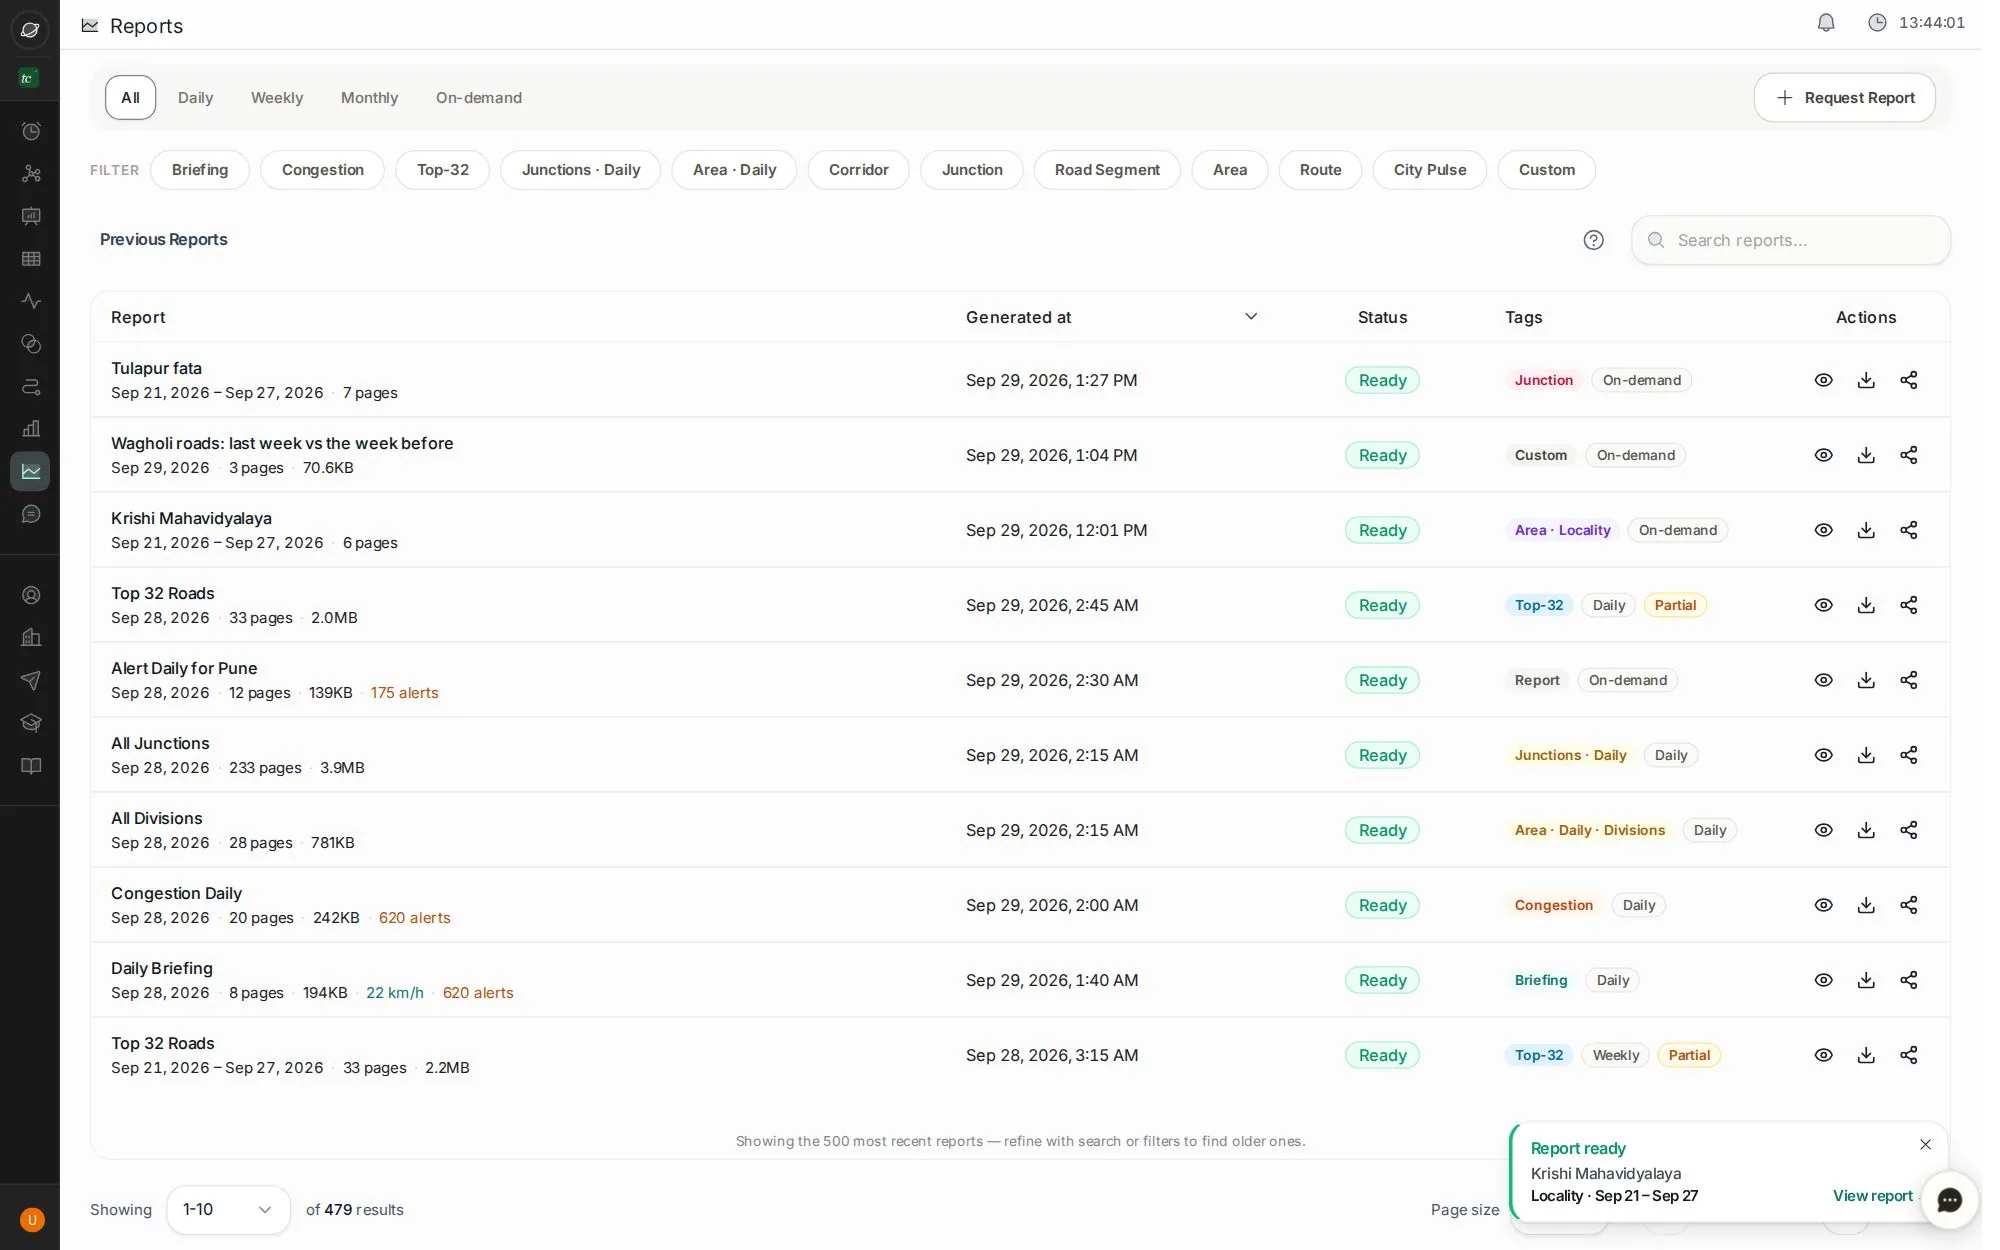
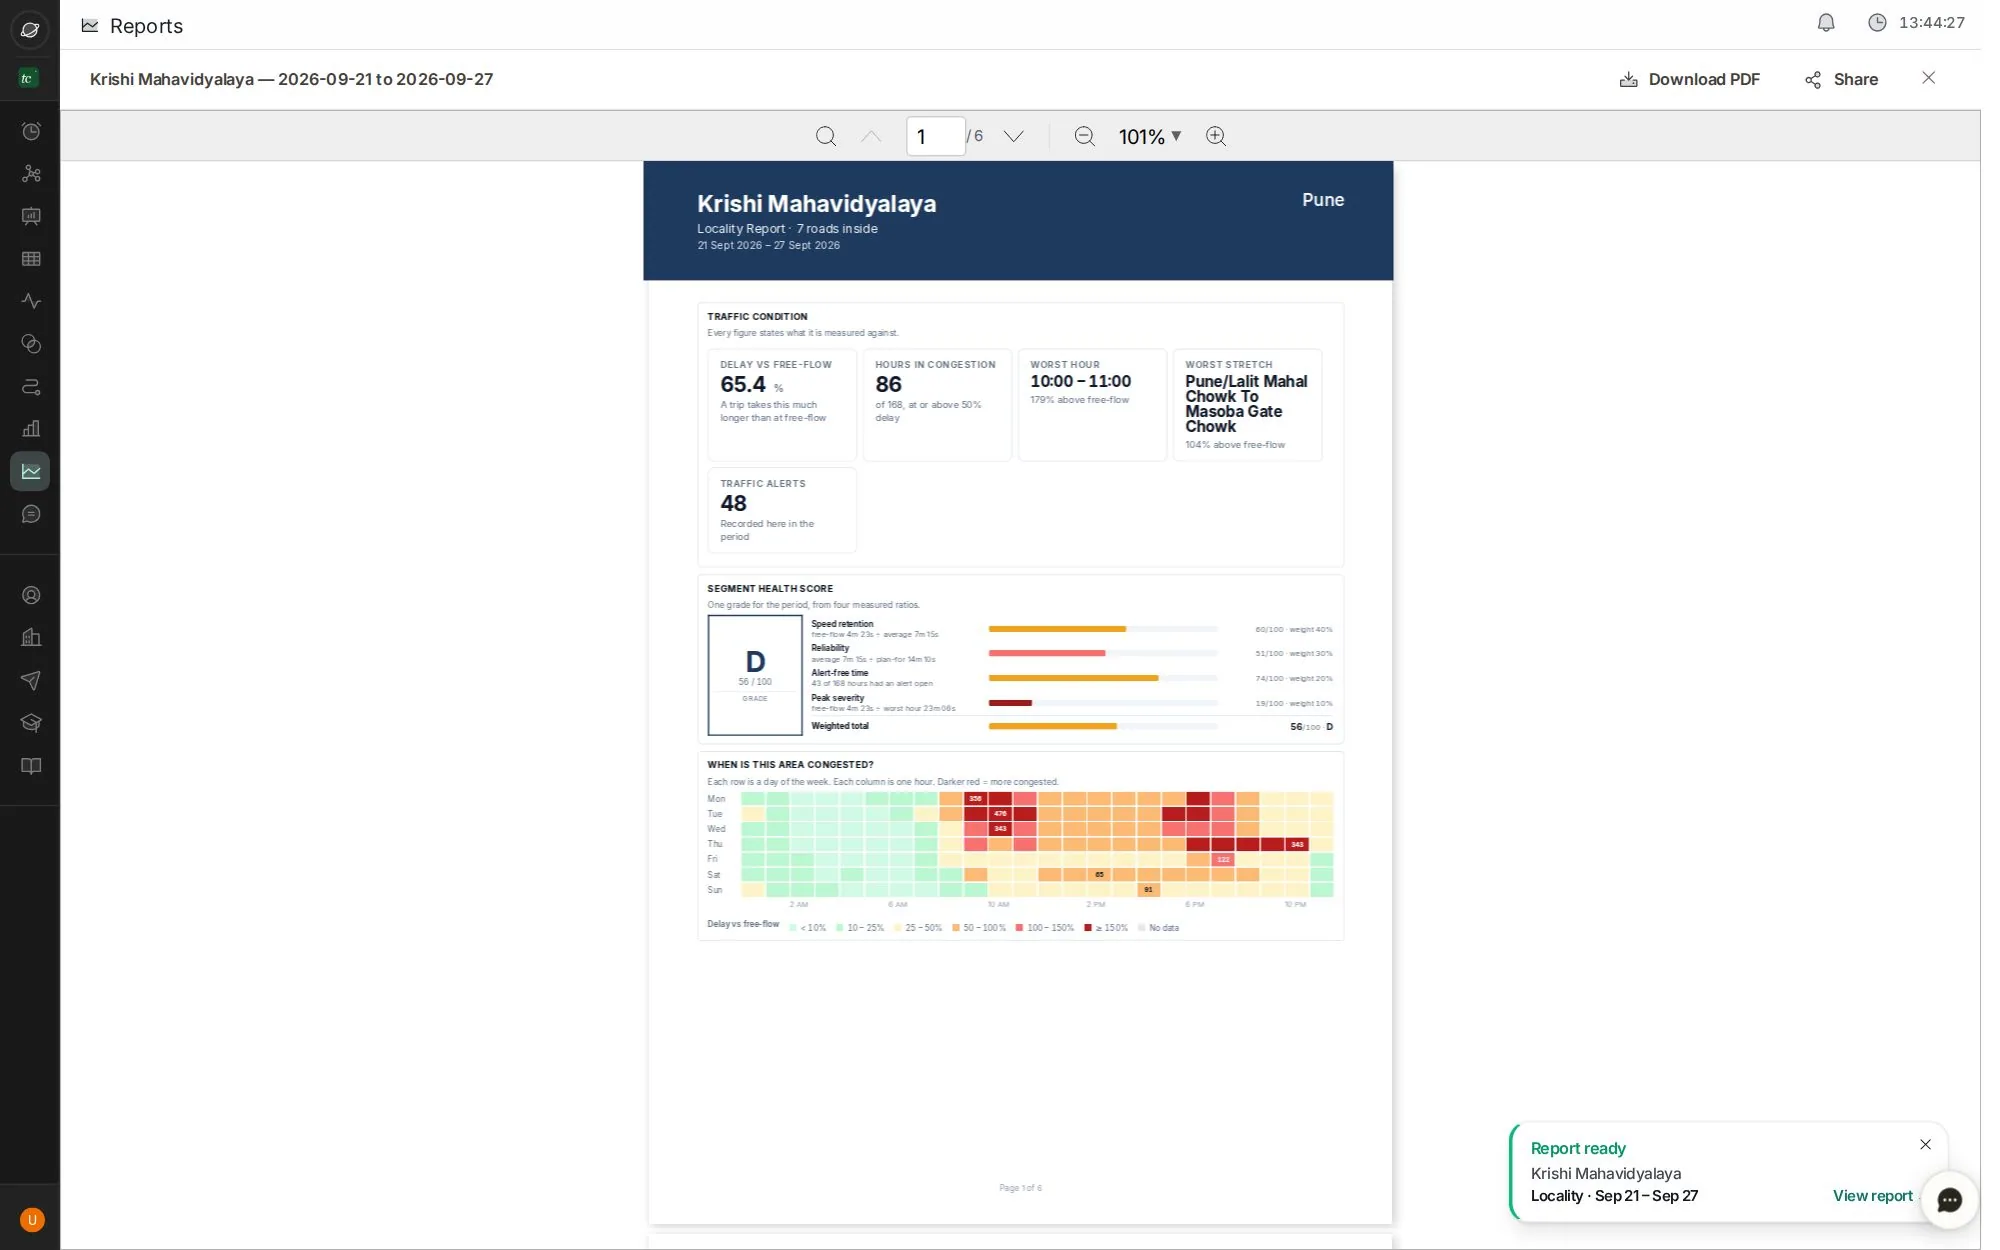
Rank every locality by delay at the evening peak, check whether it happens every day, and take a report into the meeting.
12 stepsAbout 3 minClick the blue dot, or press →
Step 1 of 12 · click
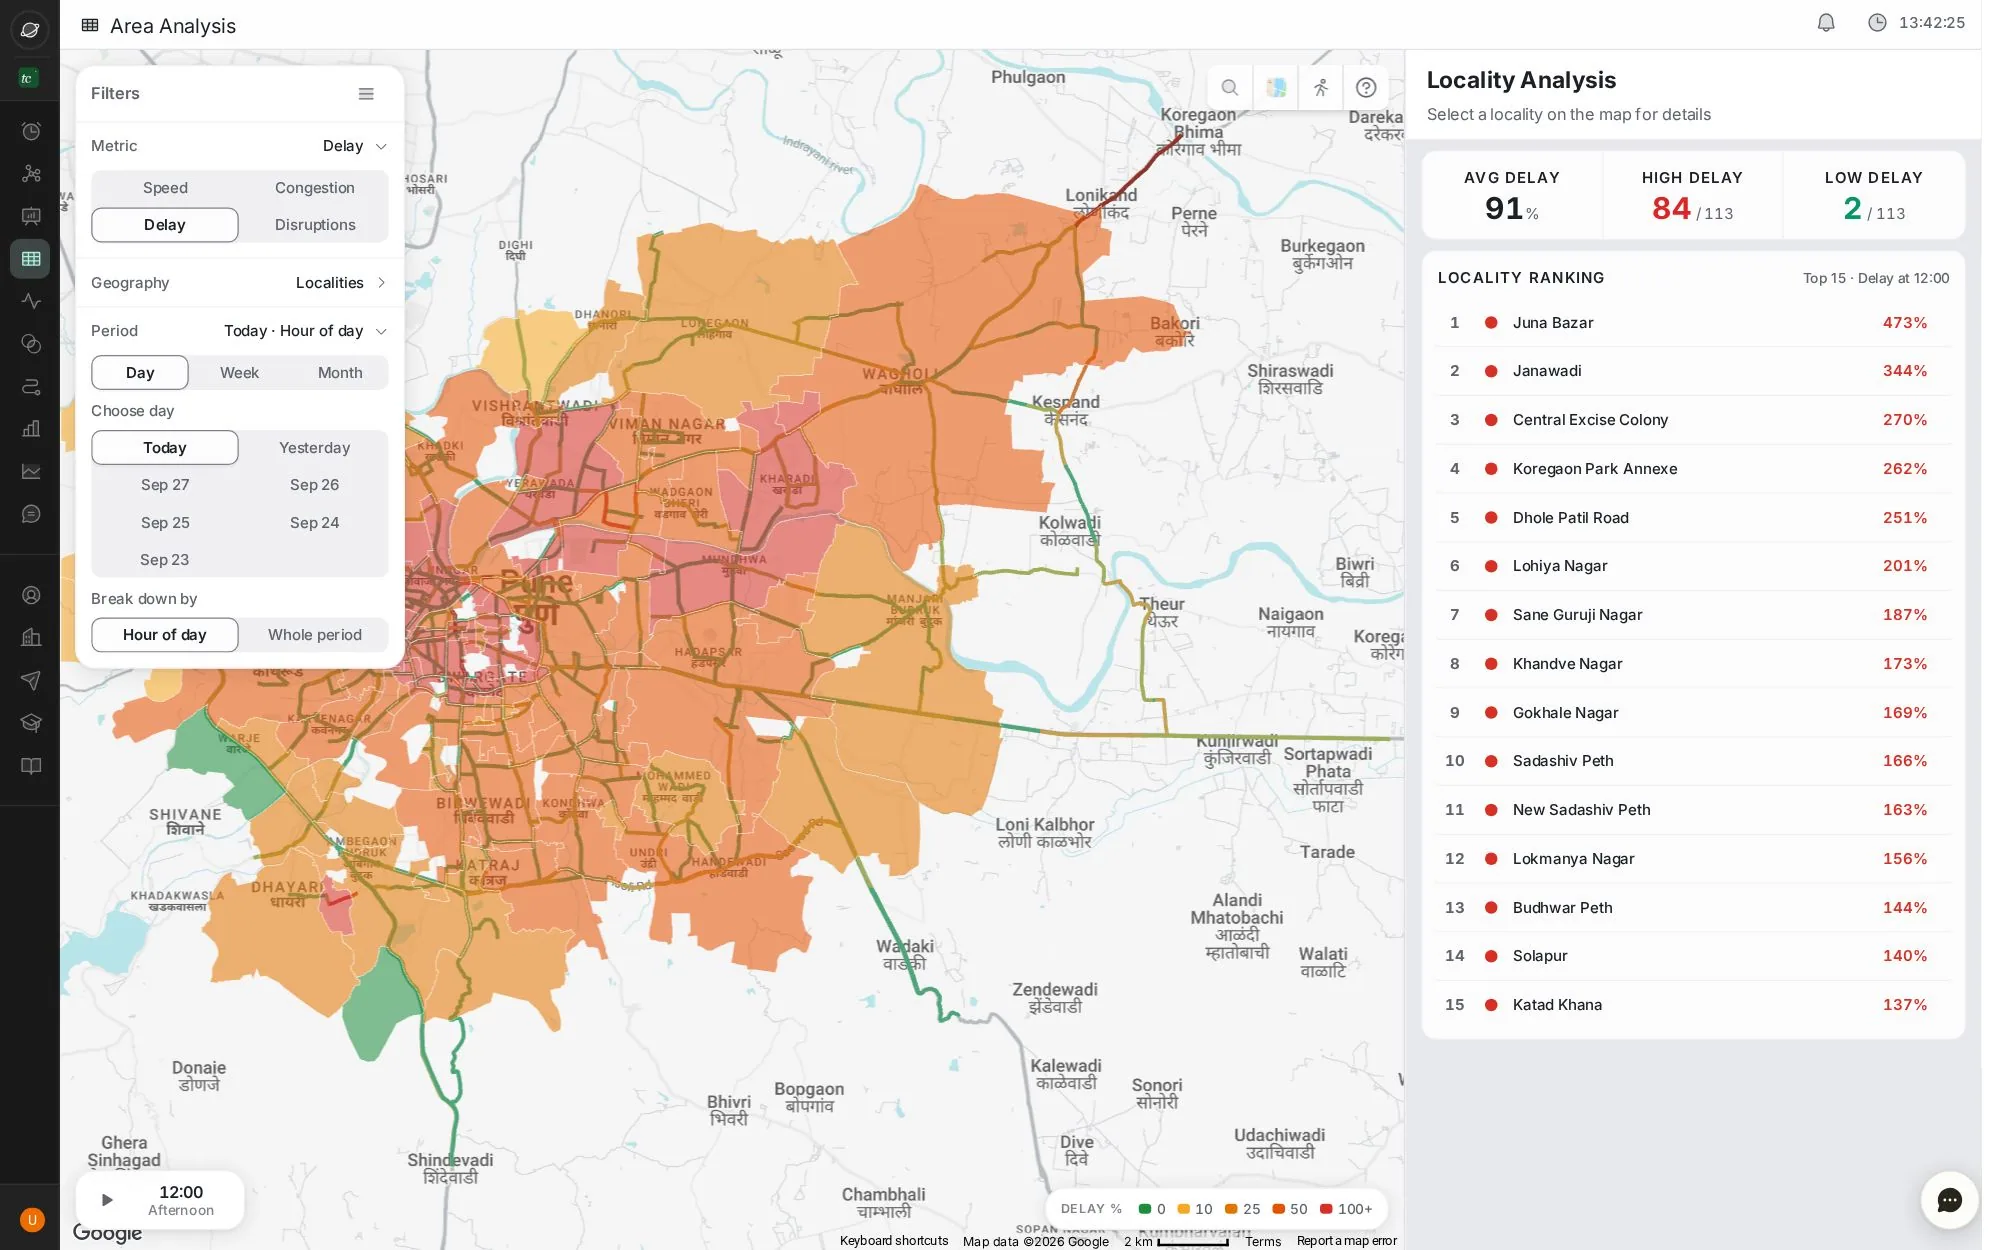
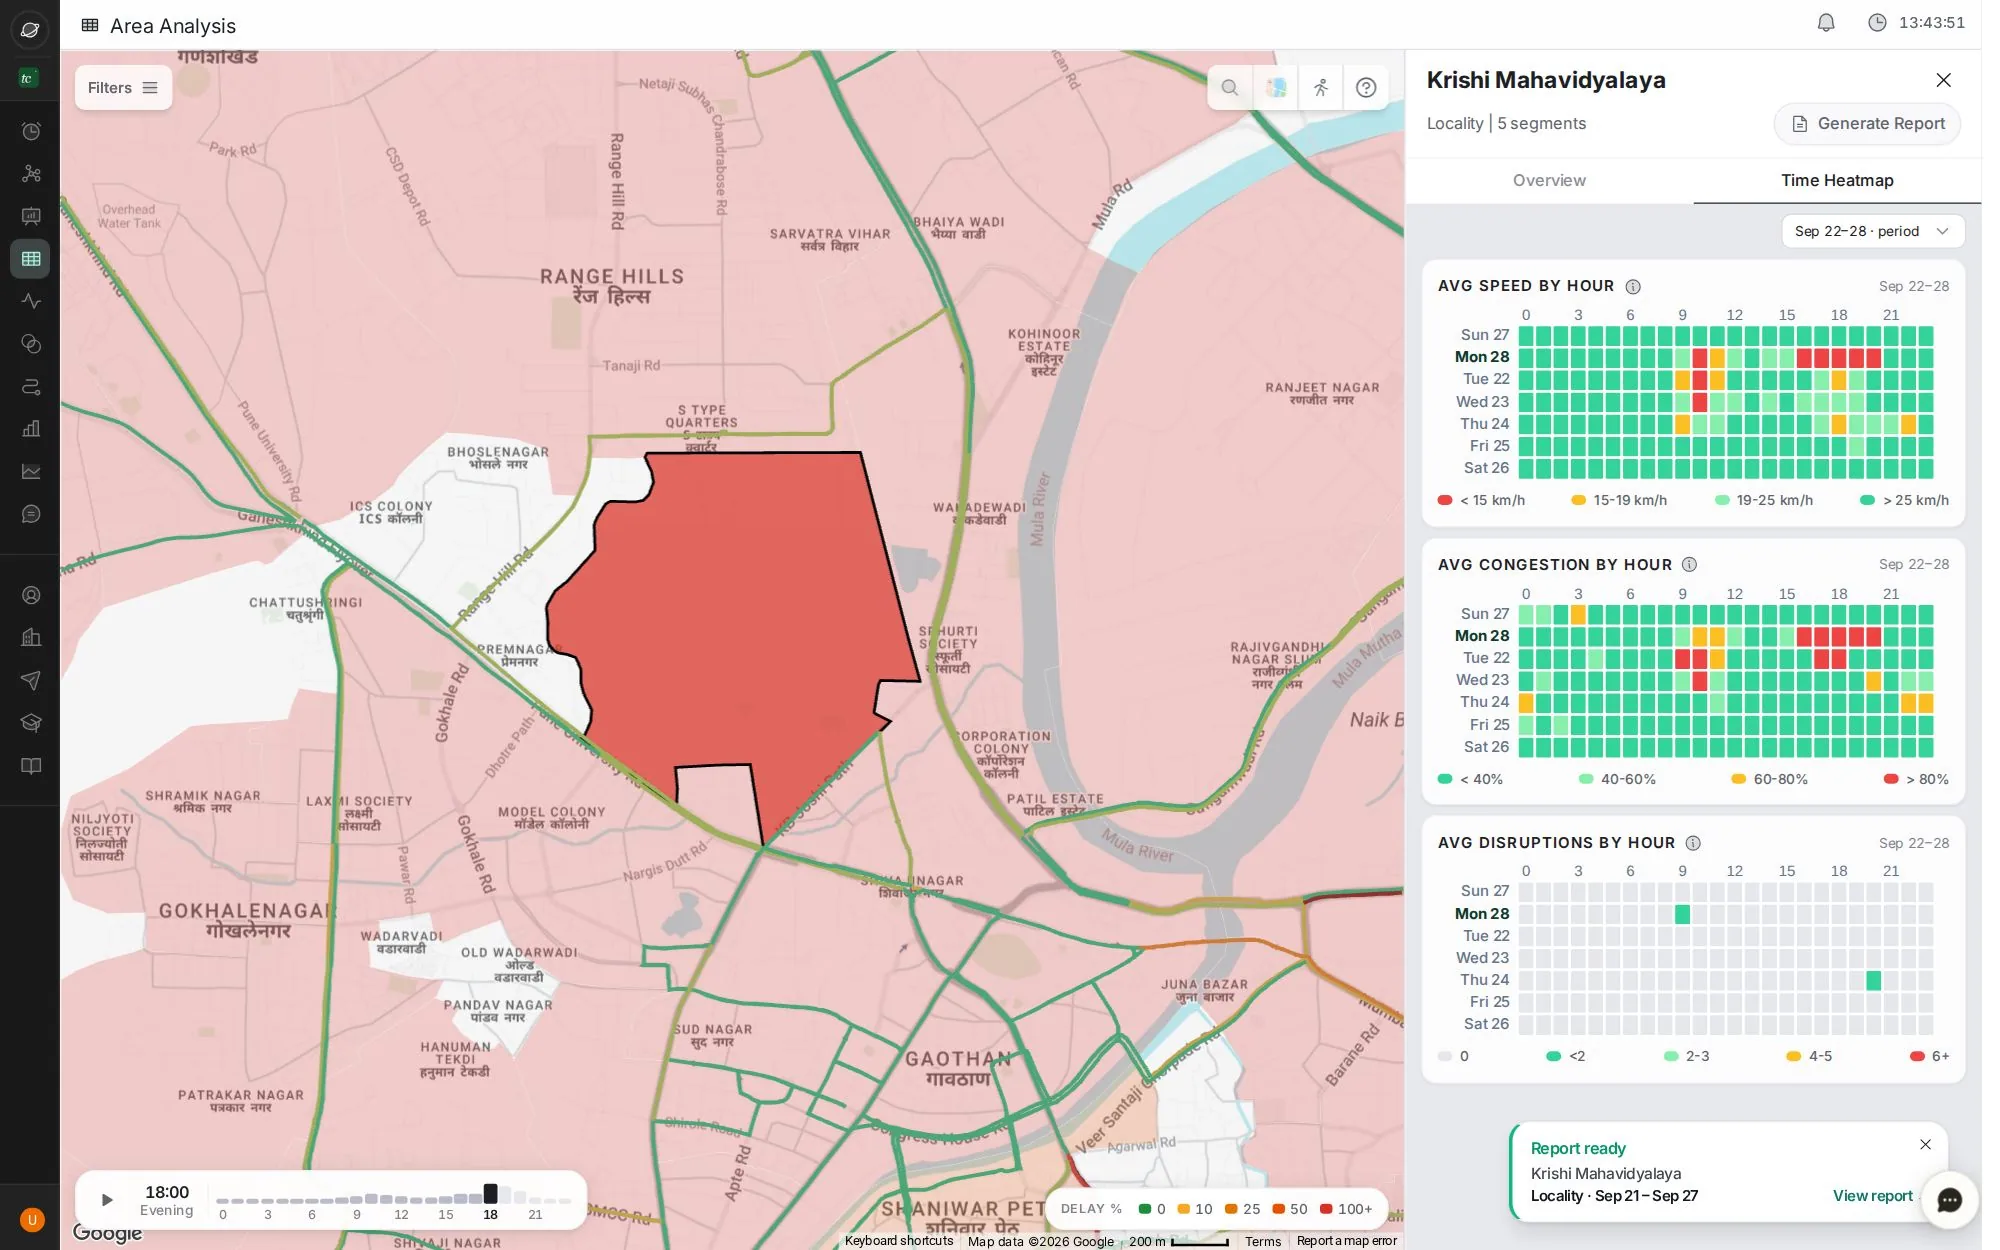
Switch the map to Delay
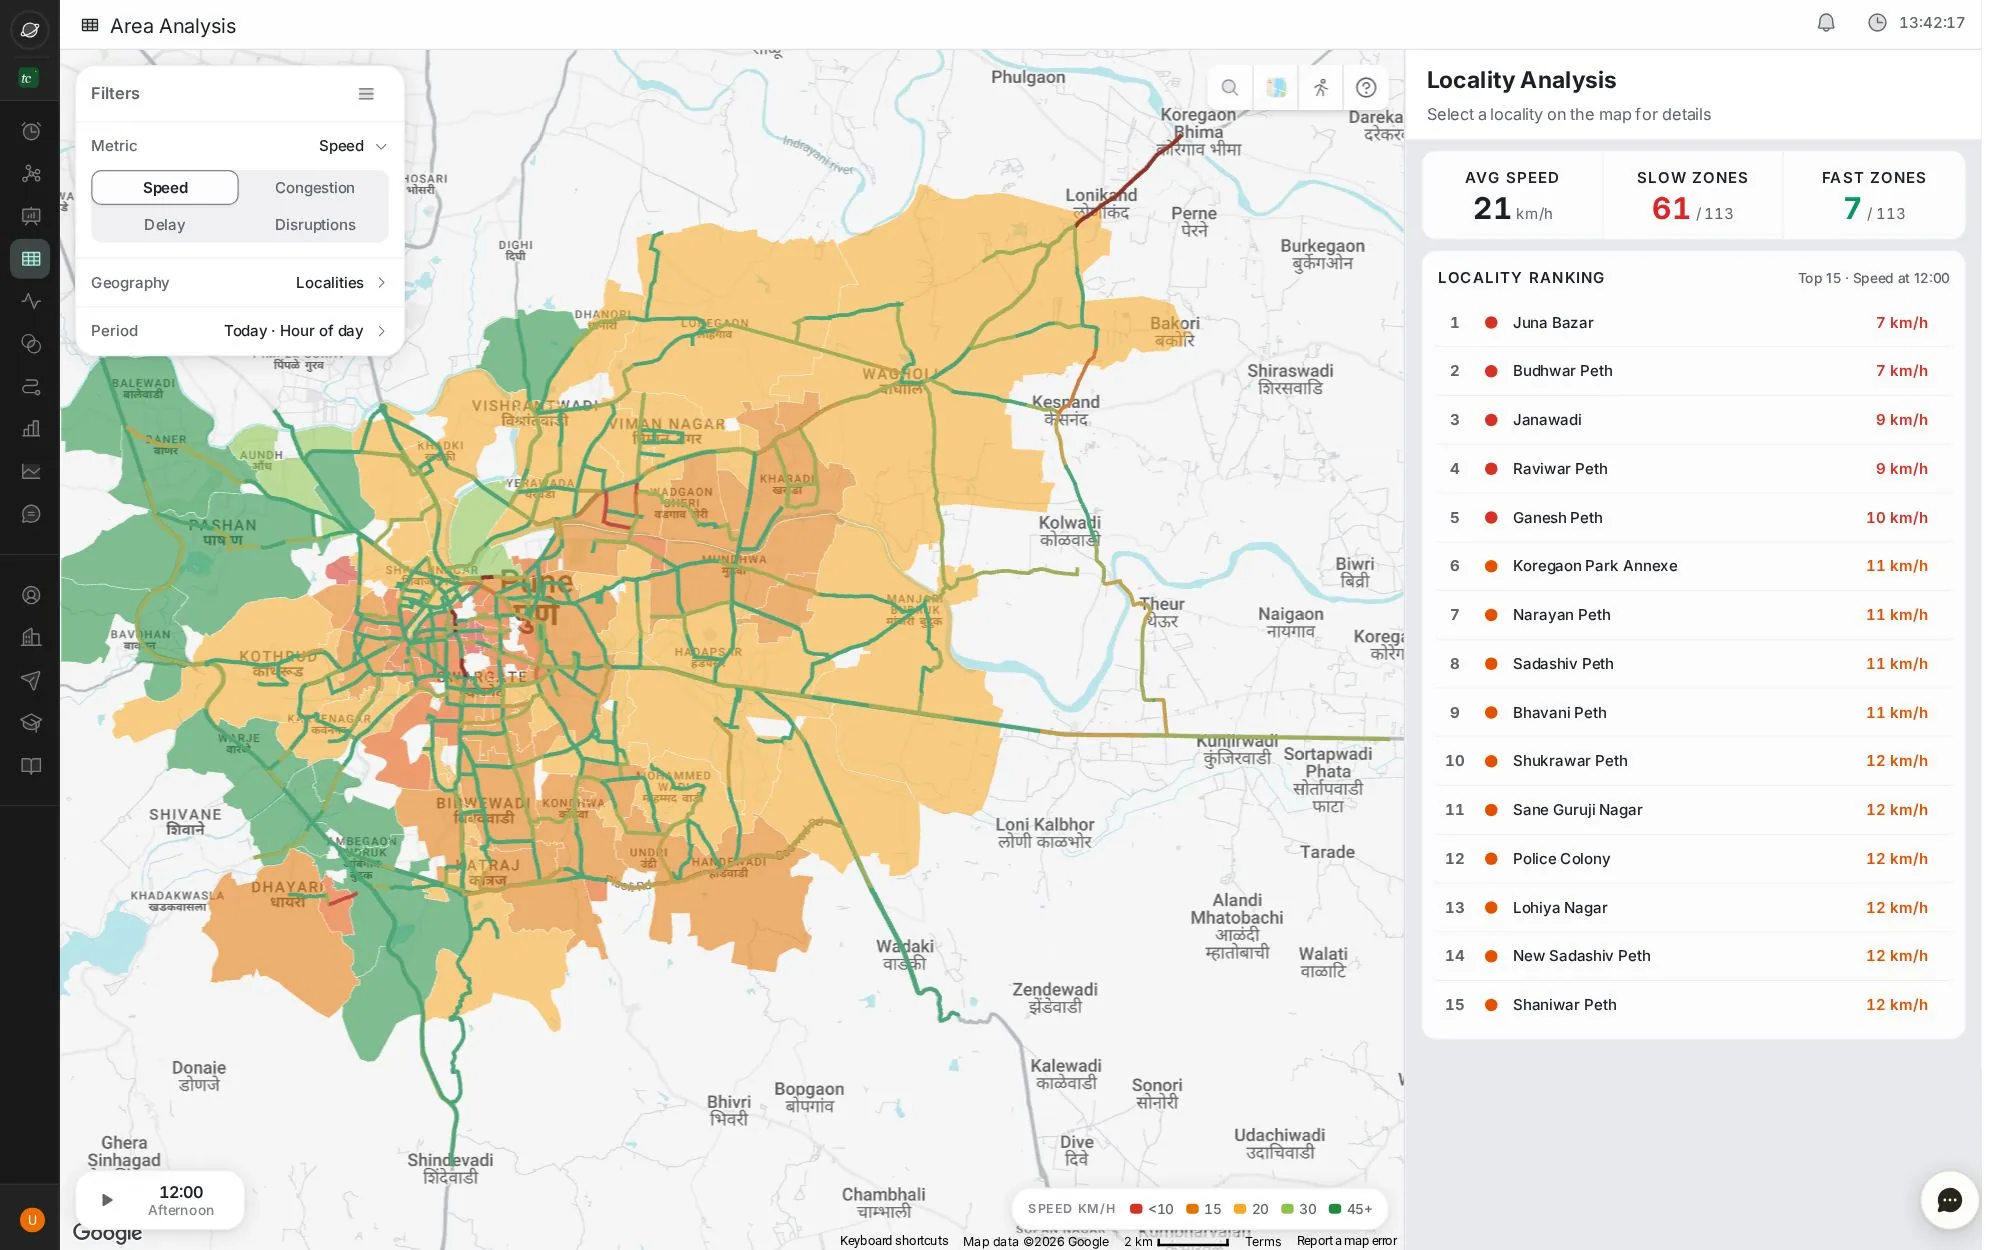
Open Area Analysis. The city is split into localities. Open Metric and pick Delay.
Why delay? Some areas are always slow. Delay measures the extra travel time against free flow, so it shows where traffic is actually congested.
Tip: use ← and → keys. Click the screen to zoom.
Next job
Fix a junction that backs up
Find which arm of a junction jams, at which hours, and hand the evidence to the signal team.
Next jobProve a change worked
Compare the weeks before and after a change, road by road, in one report.
Every buttonArea Analysis screen
The city as localities, coloured by speed, delay, congestion or disruptions, for any hour.
Verified in the live app · 29 Sept 2026 Screens from a live city workspace. Your city will look different.